Given increasingly stringent spectral constraints, future radar
transmitters will need to be adaptive and reconfigurable to allow
operation in different frequency bands and meet various spectral
constraints based on nearby wireless activity. Transmitters will have to
quickly adjust their transmission spectra, frequency of operation, and
circuitry to operate in a dynamically changing spectral environment.
Such adjustments will likely need to occur on the order of milliseconds.
The power amplifier is a critical component of radar transmitters, and
its power efficiency and spectral output are significantly dependent on
its loading. We present a new method for simultaneously optimizing the
load impedance and the input power to maximize the efficiency, while
meeting spectral constraints. This algorithm is designed to be used in
real-time optimization for reconfiguring the load impedance and input
power of an adaptive radar transmitter amplifier, and so a significant
goal of the algorithm's design is to minimize the number of experimental
queries. The optimization is based on two well-known metrics.
Efficiency is measured by the power-added efficiency (PAE), which is the
added radio frequency power divided by the direct current supply power.
Spectral spreading is measured by the adjacent-channel power ratio
(ACPR), which is the ratio of the power in a defined adjacent channel to
the power in the designated operating channel.
Adaptive radar has been a topic of discussion since the early 1970s [1].
In the modern era of tight spectrum allocations, adaptive radar will
need reconfigurable circuitry to allow real-time adjustments to change
spectral output, operating frequency, and power efficiency.
Lu et al. and Vaka-Heikkila and Rebeiz describe use of
microelectromechanical system switches to build amplifiers with adaptive
output matching networks [2], [3].
Deve et al. present an adaptive impedance tuner capable of adjusting
operating frequency between 1 and 3 GHz, a frequency range useful for
many sensing applications [4].
Sun et al. predict the criticality of intelligent impedance matching
with minimized tuning iterations for reconfigurable transmitters [5]. Real-time antenna impedance matching has been demonstrated by Sun and Sun and Lau [6], [7], and Qiao et al. demonstrate the use of a genetic algorithm to tune an amplifier in real time [8], although du Plessis and Abrie predict that genetic algorithms will be slow in tuning for many applications [9].
Much of the previous work in impedance tuning has been performed for
communications applications, but Baylis et al. describe the importance
of reconfigurable power amplifiers in solving the radar-communications
coexistence problem [10]. Recent radar
developments include design of adaptive waveforms and circuits that can
optimize for power efficiency and spectral compliance, including the
effects of transmitter distortion.
Blunt et al. describe the use of polyphase-coded frequency modulation
waveforms for good power efficiency and spectral performance [11]
and present optimization of these waveforms with transmitter amplifier
distortion considered, both via a model and in actual measurements [12].
The variation of PAE and ACPR with both load reflection coefficient  $\Gamma_{L}$ and input power
  $P_{in}$ is well documented.
Snider describes how the load impedance providing optimal efficiency
varies with input power level and demonstrates that the output power is
significantly dependent on both the load impedance and the input power
level [13], and Nemati et al. show variation of the optimum PAE load impedance with changing input power [14].
Fu and Mortazawi show the design of a reconfigurable power amplifier
using tunable varactors and also show that the load impedance in the
Smith chart providing optimum efficiency is different for different
output power levels [15]. Hajji et al. show that a change in input power can be useful in obtaining constant intermodulation rejection [16], related to the adjacent-channel spreading of amplifiers under broadband signal excitation. Load modulation to provide efficiency in Doherty amplifiers is discussed by Nam et al. [17].
$P_{in}$ is well documented.
Snider describes how the load impedance providing optimal efficiency
varies with input power level and demonstrates that the output power is
significantly dependent on both the load impedance and the input power
level [13], and Nemati et al. show variation of the optimum PAE load impedance with changing input power [14].
Fu and Mortazawi show the design of a reconfigurable power amplifier
using tunable varactors and also show that the load impedance in the
Smith chart providing optimum efficiency is different for different
output power levels [15]. Hajji et al. show that a change in input power can be useful in obtaining constant intermodulation rejection [16], related to the adjacent-channel spreading of amplifiers under broadband signal excitation. Load modulation to provide efficiency in Doherty amplifiers is discussed by Nam et al. [17].
Our previous work introduces the input power Smith tube (Fig. 1) to visualize how a criterion (such as PAE or ACPR) varies with both load reflection coefficient and input power [18].
Previous Smith chart extensions include a spherical extension of the
Smith chart to consider both positive and negative resistances in
circuit design [19], [20], a Smith chart generalization allowing fractional circuit elements to be considered [21], and an adjusted Smith chart for design with lossy transmission lines [22].
The purpose of the present paper is to show how an optimum combination of  $\Gamma_{L}$ and
  $P_{in}$ can be obtained quickly, using a small number of measurements, through a fast search algorithm in the power Smith tube. The desired optimization is an example of biobjective optimization [23], [24] and is applied to the well-known trade-off of linearity and efficiency [25], [26].
A previous paper by our group demonstrates optimization for linearity
and efficiency using only the real and imaginary parts of
$P_{in}$ can be obtained quickly, using a small number of measurements, through a fast search algorithm in the power Smith tube. The desired optimization is an example of biobjective optimization [23], [24] and is applied to the well-known trade-off of linearity and efficiency [25], [26].
A previous paper by our group demonstrates optimization for linearity
and efficiency using only the real and imaginary parts of  $\Gamma_{L}$ as the input parameters [27],
and the present paper extends the solution of this problem to a third
dimension, allowing simultaneous optimization of input power with
$\Gamma_{L}$ as the input parameters [27],
and the present paper extends the solution of this problem to a third
dimension, allowing simultaneous optimization of input power with  $\Gamma_{L}$ to provide the highest PAE possible under ACPR constraints.
Section II presents the basics of the search algorithm to be applied in the Smith tube. Section III describes simulation results of the algorithm's application. Section IV provides results from measurement testing of the algorithm. Finally, Section V provides conclusions based on the presented results.
SECTION II
ALGORITHM DETAILS
The search algorithm is based on estimation of the PAE and ACPR
gradients within the three-dimensional input power Smith tube. First,
the input power, on the vertical axis of the Smith tube, is normalized
so that the user-defined maximum input power is assigned the value 1 and
the user-defined minimum input power is assigned the value −1. This
scales the vertical limitations of the cylindrical search space (the
Smith tube) to the same dimensions as the planar values of  $\Gamma_{L}$ in the horizontal dimension. The normalized input power
  $p_{in}$ (with a lowercase
  $``p^{\prime\prime}$) is defined as follows (all power values are in dBm, decibels with respect to 1 milliwatt, for this paper).
 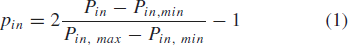 TeX Source\begin{equation*} p_{in}=2 \frac{P_{in}-P_{in, min}}{P_{in, max}-P_{in, min}}-1 \tag{1} \end{equation*}
This equation normalizes the range of  $P_{in}$ to set the minimum to −1 and the maximum to 1. The normalized input power
  $p_{in}$ represents the input power for purposes of calculating and evaluating gradients.
Although the three-dimensional search is limited by the power Smith
tube's cylindrical space, the search vectors can be laid out in
Cartesian dimensions, because the horizontal coordinates represent the
real and imaginary parts of  $\Gamma_{L}$. The vertical coordinate
  $p_{in}$ provides the third of the three Cartesian dimensions.
Using Cartesian coordinates allows direct extension of the search space
used in the two-dimensional algorithm for the same objectives [27].
$p_{in}$ provides the third of the three Cartesian dimensions.
Using Cartesian coordinates allows direct extension of the search space
used in the two-dimensional algorithm for the same objectives [27].
A search vector  $\overline{v}$
can be added to a candidate in the Smith tube to find the subsequent
candidate in the search. When the candidate from which the search is
operating does not possess an acceptable ACPR value, this search vector
is defined as follows:
$\overline{v}$
can be added to a candidate in the Smith tube to find the subsequent
candidate in the search. When the candidate from which the search is
operating does not possess an acceptable ACPR value, this search vector
is defined as follows:  TeX Source\begin{equation*} \overline{v}=\hat{a}D_{a}+\hat{b}D_{b}, \tag{2} \end{equation*} where
 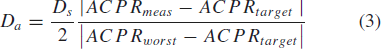 TeX Source\begin{equation*}
D_{a}=\frac{D_{s}}{2}\frac{\vert ACPR_{meas}-ACPR_{target}\vert}{\vert
ACPR_{worst}-ACPR_{target}\vert}\tag{3} \end{equation*} and
TeX Source\begin{equation*}
D_{a}=\frac{D_{s}}{2}\frac{\vert ACPR_{meas}-ACPR_{target}\vert}{\vert
ACPR_{worst}-ACPR_{target}\vert}\tag{3} \end{equation*} and 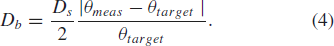 TeX Source\begin{equation*} D_{b}=\frac{D_{s}}{2}\frac{\vert \theta_{meas}-\theta_{target}\vert}{\theta_{target}}. \tag{4} \end{equation*}
  $D_{s}$ is the search distance parameter and is provided by the user. It provides scaling for both components of the search vector [(3) and (4)].
  $ACPR_{meas}$ is the measured value of ACPR at the present candidate point.
  $ACPR_{target}$ is the maximum acceptable value of ACPR.
  $ACPR_{worst}$ is the largest value of ACPR measured to this point in the search.
  $\theta$ is the angle between vectors
  $\hat{a}$ and
  $\hat{b}$. In (2), the vectors
  $\hat{a}$ and
  $\hat{b}$
represent vectors in the direction of ACPR steepest descent and the
bisector between the ACPR steepest descent and PAE steepest ascent
vectors. On the Pareto optimum locus, which is the curve of constrained solutions, the gradients will be oppositely directed [6], and the value of
$\hat{b}$
represent vectors in the direction of ACPR steepest descent and the
bisector between the ACPR steepest descent and PAE steepest ascent
vectors. On the Pareto optimum locus, which is the curve of constrained solutions, the gradients will be oppositely directed [6], and the value of  $\theta$ (the half-angle between the gradients) will be 90°. Thus,
  $\theta_{target}=90^{\circ}$ in (4).
  $\theta_{meas}$ is the measured value of
  $\theta$ at the candidate under consideration. Fig. 2 shows that the gradients can be evaluated in the three-dimensional space. If PAE is represented by the variable
  $p$, the gradient for the PAE is given in terms of the unit coordinate vectors
  $\hat{\Gamma}_{r},\hat{\Gamma}_{i}$, and
  $\hat{p}_{in}$ by
  TeX Source\begin{equation*}
\nabla p=\hat{\Gamma}_{r}\frac{\partial
p}{\partial\Gamma_{r}}+\hat{\Gamma}_{i}\frac{\partial
p}{\partial\Gamma_{i}}+\hat{p}_{in}\frac{\partial p}{\partial p_{in}}.
\tag{5} \end{equation*}
TeX Source\begin{equation*}
\nabla p=\hat{\Gamma}_{r}\frac{\partial
p}{\partial\Gamma_{r}}+\hat{\Gamma}_{i}\frac{\partial
p}{\partial\Gamma_{i}}+\hat{p}_{in}\frac{\partial p}{\partial p_{in}}.
\tag{5} \end{equation*}
The partial derivatives to calculate this gradient are estimated from
a measurement separated from the candidate in the Smith tube by a
neighboring-point distance  $D_{n}$ in each coordinate direction, as shown in Fig. 2. From a measurement of the change in power
  $\Delta p$ at a change in the real part of the load reflection coefficient,
  $\Gamma_{r}$, the partial-derivative estimation follows as
 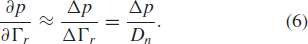 TeX Source\begin{equation*}
\frac{\partial p}{\partial\Gamma_{r}}\approx\frac{\Delta
p}{\Delta\Gamma_{r}}=\frac{\Delta p}{D_{n}}. \tag{6} \end{equation*}
TeX Source\begin{equation*}
\frac{\partial p}{\partial\Gamma_{r}}\approx\frac{\Delta
p}{\Delta\Gamma_{r}}=\frac{\Delta p}{D_{n}}. \tag{6} \end{equation*}
From a measurement of the change in power for a change in the imaginary part of the load reflection coefficient,  $\Gamma_{i}$, the partial-derivative estimation follows as
 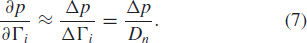 TeX Source\begin{equation*}
\frac{\partial p}{\partial \Gamma_{i}}\approx\frac{\Delta
p}{\Delta\Gamma_{i}}=\frac{\Delta p}{D_{n}}. \tag{7} \end{equation*}
TeX Source\begin{equation*}
\frac{\partial p}{\partial \Gamma_{i}}\approx\frac{\Delta
p}{\Delta\Gamma_{i}}=\frac{\Delta p}{D_{n}}. \tag{7} \end{equation*}
Finally, from a measurement of the change in power  $\Delta p$ at a change in
  $p_{in}$, the calculation follows as
 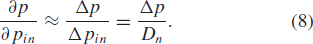 TeX Source\begin{equation*}
\frac{\partial p}{\partial p_{in}}\approx\frac{\Delta p}{\Delta
p_{in}}=\frac{\Delta p}{D_{n}}. \tag{8} \end{equation*}
TeX Source\begin{equation*}
\frac{\partial p}{\partial p_{in}}\approx\frac{\Delta p}{\Delta
p_{in}}=\frac{\Delta p}{D_{n}}. \tag{8} \end{equation*}
Because normalized power  $p_{in}$ (lowercase) is being used, as defined by (1), the same step
  $D_{n}$
is used in the vertical direction for the partial derivative estimation
as for the horizontal directions. This completes the estimation of the
gradient vector given by (5). The unit vector in the direction of increasing PAE can be taken by dividing the gradient by its magnitude:
$D_{n}$
is used in the vertical direction for the partial derivative estimation
as for the horizontal directions. This completes the estimation of the
gradient vector given by (5). The unit vector in the direction of increasing PAE can be taken by dividing the gradient by its magnitude: 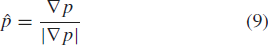 TeX Source\begin{equation*} \hat{p}=\frac{\nabla p}{\vert \nabla p\vert}\tag{9} \end{equation*}
An approach similar to (5) through (8)
can be used to estimate the gradient for ACPR. Because minimization is
desired for the ACPR, the direction of optimal travel is given by a unit
vector  $\hat{a}$ oriented oppositely to the ACPR gradient:
  TeX Source\begin{equation*} \hat{a}=-\frac{\nabla a}{\vert \nabla a\vert}. \tag{10} \end{equation*}
The three-dimensional bisector of  $\hat{a}$ and
  $\hat{p}$ is defined as the arithmetic mean of the vectors
  $\hat{p}$ and
  $\hat{a}$. Because
  $\hat{a}$ and
  $\hat{p}$ are both unit vectors, the mean (bisector) given by
  TeX Source\begin{equation*} \hat{b}=\frac{1}{2}(\hat{a}+\hat{p}) \tag{11} \end{equation*} is also a unit vector.
Fig. 3 shows the resultant search vectors for the cases when ACPR at the present candidate is out of compliance (Fig. 3a) and when ACPR at the present candidate is within compliance (Fig. 3b). When the ACPR is in compliance, the search vector (2) is changed to have a component in the  $\hat{p}$ direction instead of the
  $\hat{a}$ direction:
  TeX Source\begin{equation*} \overline{v}=\hat{p}D_{a}+\hat{b}D_{b}. \tag{12} \end{equation*}
A noticeable result of using (2) when the search is out of ACPR compliance and (12)
when the search is in compliance is that the search firsts attempts to
try to reach the region of ACPR compliance. When the initiating
candidate is out of compliance, (2) is used, meaning that the search vector has a component of  $\hat{a}$, which causes a component of travel toward the ACPR minimum. An
  $\hat{a}$
component will be present in each search vector until the region of
ACPR compliance is reached. When an initiating candidate is inside the
region of ACPR compliance, (12) is used, meaning that the
$\hat{a}$
component will be present in each search vector until the region of
ACPR compliance is reached. When an initiating candidate is inside the
region of ACPR compliance, (12) is used, meaning that the  $\hat{a}$ component of (2) is replaced by a
  $\hat{p}$
component of the same magnitude. This means that the search replaces
its initial quest for the acceptable region by going toward the PAE
optimum. It progresses with this component directed toward the optimum
PAE point, as long as it remains in compliance. In the results shown in
the following section, note that the first effort of each search is to
reach the region of ACPR compliance. If the starting point of the search
is outside the ACPR compliance region, this can result in an initial
downward trajectory of the search for several candidates, followed by a
subsequent upward trajectory once the search enters the ACPR compliance
region.
$\hat{p}$
component of the same magnitude. This means that the search replaces
its initial quest for the acceptable region by going toward the PAE
optimum. It progresses with this component directed toward the optimum
PAE point, as long as it remains in compliance. In the results shown in
the following section, note that the first effort of each search is to
reach the region of ACPR compliance. If the starting point of the search
is outside the ACPR compliance region, this can result in an initial
downward trajectory of the search for several candidates, followed by a
subsequent upward trajectory once the search enters the ACPR compliance
region.
The speed and resolution of the algorithm's convergence are dependent
on the starting point and the parameter values selected for the search
distance  $D_{s}$ and neighboring-point distance
  $D_{n}$.
Although further analysis could be performed to find the optimal values
of these parameters given domain expertise and desired outcomes, this
topic is saved for a later paper. In general, larger values of
$D_{n}$.
Although further analysis could be performed to find the optimal values
of these parameters given domain expertise and desired outcomes, this
topic is saved for a later paper. In general, larger values of  $D_{s}$
are suggested for use if the vicinity of the end point is unknown; if
the search is believed to start near the optimum, then a smaller value
of
$D_{s}$
are suggested for use if the vicinity of the end point is unknown; if
the search is believed to start near the optimum, then a smaller value
of  $D_{s}$ may reduce the number of measurements.
If the search reaches the region of ACPR compliance and then tries to leave, the search distance parameter  $D_{s}$
is divided by two, and the search returns to the last candidate in the
acceptable ACPR region and calculates a new search vector using the
modified
$D_{s}$
is divided by two, and the search returns to the last candidate in the
acceptable ACPR region and calculates a new search vector using the
modified  $D_{s}$.
In addition to this penalization for leaving the acceptable region, the
search vector tends to get smaller as it approaches the optimum,
because
$D_{s}$.
In addition to this penalization for leaving the acceptable region, the
search vector tends to get smaller as it approaches the optimum,
because  $ACPR_{meas}$ tends to approach
  $ACPR_{target}$ and
  $\theta_{meas}$ tends to approach
  $\theta_{target}$, decreasing the search vector components according to (3) and (4), respectively. When the size of the search vector
  $\vert \overline{v}\vert$ decreases below a prespecified value (often the same as
  $D_{n}$),
the search ends, and the measured point with the highest PAE that meets
ACPR requirements is declared the constrained optimum.
$D_{n}$),
the search ends, and the measured point with the highest PAE that meets
ACPR requirements is declared the constrained optimum.
SECTION III
SIMULATION RESULTS
The algorithm was first tested in simulations using a nonlinear
transistor model in the Advanced Design System (ADS) simulator from
Keysight Technologies. A cosimulation was constructed using MATLAB to
perform algorithm-controlled ADS simulations. In the cosimulation,
MATLAB is used to control an ADS nonlinear circuit simulation when
supplied a netlist by ADS, including the values of  $P_{in}$ and
  $\Gamma_{L}$,
and then MATLAB reads the results from ADS and performs algorithmic
decisions, recalling ADS for each required circuit simulation in the
algorithm's execution. For the design, a constraint of
$\Gamma_{L}$,
and then MATLAB reads the results from ADS and performs algorithmic
decisions, recalling ADS for each required circuit simulation in the
algorithm's execution. For the design, a constraint of  $\mathrm{ACPR}\leq-40\text{dBc}$ was imposed on the design. The goal was to obtain the highest PAE, while meeting this ACPR constraint.
For comparison with the algorithm results, load-pull simulations
spanning the Smith chart were performed at multiple input power levels
and are shown in Fig. 4, as presented in [6]. This exhaustive measurement shows that the ACPR-constrained optimum point is at
$\mathrm{ACPR}\leq-40\text{dBc}$ was imposed on the design. The goal was to obtain the highest PAE, while meeting this ACPR constraint.
For comparison with the algorithm results, load-pull simulations
spanning the Smith chart were performed at multiple input power levels
and are shown in Fig. 4, as presented in [6]. This exhaustive measurement shows that the ACPR-constrained optimum point is at  $P_{in}=21.75\text{dBm}$ and
  $\Gamma_{L}=0.80/\underline{180^{\circ}}$. The maximum PAE providing
  $\mathrm{ACPR}\leq-40\text{dBc}$ is 40.18% at this point.
Simulation tests of the algorithm were performed using a stepsize  $D_{s}=1.5$, neighboring-point distance
  $D_{n}=0.05$, and input power range
  $0\text{dBm}\leq P_{in}\leq 36\text{dBm}$. Because
  $D_{n}$ and
  $D_{s}$ have units consistent with the dimensions of the Smith chart, they possess the same units as load reflection coefficient
  $\Gamma_{L}$ and are unitless. Figure 5 shows the trajectory of a search starting from
  $\Gamma_{L}=0.5/\underline{90^{\circ}}, P_{in}=5\text{dBm}$. A total of 33 measured points was required for the search to converge to the end parameter values of
  $\Gamma_{L}=0.79/\underline{-178.6^{\circ}}$ and
  $P_{in}=21.58\text{dBm}$. At this end point,
  $\mathrm{PAE}=41.13\%$ and
  $\mathrm{ACPR}=-40.08\text{dBc}$ were obtained. Fig. 6 shows the search trajectory for a starting point of
  $\Gamma_{L}=0.80/\underline{0^{\circ}}, \ P_{in}=0\text{dBm}$. Notice that while the starting conditions were very different in both cases, the end point values of
  $\Gamma_{L}, P_{in}$,
PAE, and ACPR are very similar. This indicates that both searches
converge to approximately the same location in the Smith tube.
$\Gamma_{L}, P_{in}$,
PAE, and ACPR are very similar. This indicates that both searches
converge to approximately the same location in the Smith tube.
Figs. 7 through 9 show the search results for additional different starting combinations of  $\Gamma_{L}$ and
  $P_{in}$. Table I
summarizes the search results for the different starting combinations.
The results show that the final values of PAE vary less than 1%. The
ending ACPR values are all within 0.2 dB of the −40-dBc limiting value.
The end point
$P_{in}$. Table I
summarizes the search results for the different starting combinations.
The results show that the final values of PAE vary less than 1%. The
ending ACPR values are all within 0.2 dB of the −40-dBc limiting value.
The end point  $\Gamma_{L}$ coordinates are also similar, and the variation across end point
  $P_{in}$
values is less than 1 dB. The results all compare well with the optimum
value obtained from the exhaustive load-pull search. Interestingly, the
PAE values obtained from the algorithm are all slightly better than the
optimum obtained through the exhaustive measurement, because the points
measured in the Smith tube for the exhaustive measurement are spaced in
a way that the resolution of the optimum's determination is less than
the shorter, algorithm-based search. This shows that excellent
resolution can be obtained by the fast search, even if no initial
information is known about the location of the optimum.
$P_{in}$
values is less than 1 dB. The results all compare well with the optimum
value obtained from the exhaustive load-pull search. Interestingly, the
PAE values obtained from the algorithm are all slightly better than the
optimum obtained through the exhaustive measurement, because the points
measured in the Smith tube for the exhaustive measurement are spaced in
a way that the resolution of the optimum's determination is less than
the shorter, algorithm-based search. This shows that excellent
resolution can be obtained by the fast search, even if no initial
information is known about the location of the optimum.
SECTION IV
MEASUREMENT RESULTS
The algorithm was measurement tested using the nonlinear load-pull test bench in the laboratory of the authors (Fig. 10).
The input waveform is supplied by the signal generator with variable
input power. Measurements of PAE are performed with the power meter, and
a spectrum analyzer is used to measure ACPR. The algorithm was tested
on a Skyworks SKY5017-70LF InGaP packaged amplifier. This device is
different from the modeled device used for the simulation test of the
algorithm, providing unrelated behavior for examining algorithm
performance. Measurement tests of the algorithm were performed using a
stepsize  $D_{s}=1.5$, neighboring-point distance
  $D_{n}=0.05$, and input power range
  $-5\text{dBm}\leq P_{in}\leq 2\text{dBm}$. An ACPR limit of −27.5 dBc was specified for this search.
For comparison with the algorithm results, Fig. 11
shows a plot of the constant ACPR surface for the −27.5-dBc limiting
value, extracted from exhaustive, traditional load-pull measurements
performed at multiple  $P_{in}$ values. The maximum PAE value, as assessed by the traditional load pull, is 7.39%, obtained for
  $\Gamma_{L}=0.47/\underline{-41.5^{\circ}}$ and
  $P_{in}=1.5\text{dBm}$.
Figs. 12 through 16 show the search trajectory for different starting combinations of  $\Gamma_{L}$ and
  $P_{in}$. The results of the searches show excellent correspondence to each other, as summarized in Table II. Variation in end point
  $P_{in}$
across the five searches is less than 0.5 dB. All ACPR end point values
are beneath the limit and within 0.4 dB of the limiting value. End
point PAE varies by less than 0.5% across all of the searches. The
number of measurements ranges from 23 to 39. As in the simulation case,
the number of measurements required appears to be dependent on factors,
including the search starting point location relative to the optimum
point.
$P_{in}$
across the five searches is less than 0.5 dB. All ACPR end point values
are beneath the limit and within 0.4 dB of the limiting value. End
point PAE varies by less than 0.5% across all of the searches. The
number of measurements ranges from 23 to 39. As in the simulation case,
the number of measurements required appears to be dependent on factors,
including the search starting point location relative to the optimum
point.
A fast search algorithm has been presented and validated for
simultaneous optimization of power amplifier load reflection coefficient
and input power for maximum PAE, while meeting ACPR requirements. The
search has been demonstrated with simulations and measurements using the
search space of the power Smith tube. In both simulation and
measurement, the results of searches taken from multiple starting points
show excellent convergence as compared with traditional load-pull
evaluations performed at multiple values of input power. Furthermore,
the results show the ability to improve the resolution of the solution.
This results in the ability to obtain improved PAE, while meeting ACPR
requirements without having to perform load-pull measurements over very
closely spaced input power values. Excellent repeatability of the
algorithm from multiple starting points is observed in both the
simulation and measurement results.
Acknowledgement
The authors thank Keysight Technologies for cost-free loan of the Advanced Design System simulation software.


 transmission line for the load modulation is replaced by a passive high-pass
  -network, and the load-modulation circuit is also modified to function
as a power-matching circuit of the main amplifier. The amplifier has two
modes of operation, low- and high-power modes, controlled by a control
voltage. At the high power mode, both the main and auxiliary amplifiers
are operational and, at the low power mode, only the main amplifier
generates output power enhancing the efficiency. For the code-division
multiple-access environment, the amplifier at the low-power mode
provides power-added efficiency (PAE) of 39.8% and an adjacent channel
power ratio (ACPR) less than 49.8 dBc at 23.1 dBm, and the high-power
mode PAE of 37.9% and ACPR of 46.4 dBc at 28 dBm. The efficiency is
improved by approximately 18.8% at
-network, and the load-modulation circuit is also modified to function
as a power-matching circuit of the main amplifier. The amplifier has two
modes of operation, low- and high-power modes, controlled by a control
voltage. At the high power mode, both the main and auxiliary amplifiers
are operational and, at the low power mode, only the main amplifier
generates output power enhancing the efficiency. For the code-division
multiple-access environment, the amplifier at the low-power mode
provides power-added efficiency (PAE) of 39.8% and an adjacent channel
power ratio (ACPR) less than 49.8 dBc at 23.1 dBm, and the high-power
mode PAE of 37.9% and ACPR of 46.4 dBc at 28 dBm. The efficiency is
improved by approximately 18.8% at  dBm by the load-modulation technique. For the advanced mobile phone
system-mode operation, the amplifier delivers 26.1 dBm with PAE of 53%
and 30.8 dBm with 48.7% at the low and high modes, respectively.
dBm by the load-modulation technique. For the advanced mobile phone
system-mode operation, the amplifier delivers 26.1 dBm with PAE of 53%
and 30.8 dBm with 48.7% at the low and high modes, respectively.