
How the Inflation of Journal Citations Impacts Academia
Adjusted for inflation, a citation today is worth about half what it was ten years agoOver 30 years ago, I coauthored a book, Neural Smithing, on training artificial neural networks. In 2021 it was cited 112 times — more than in any previous year. Why? I wish the only reason was that my book is a classic and has stood the test of time. But the book was on training neural networks and a lot has happened in that field over the last 30 years. Another, more substantial reason, I’m afraid, is citation inflation. Stated simply, there are many more citations today than a few years ago and my book is catching its fair share.
Monetary inflation can be corrected to tell us the value of a year 2000 dollar in 2022. Likewise, citation inflation can be adjusted. A citation in 2000 was worth a lot more than it is today. The bean counters in academia don’t consider this. If they are committed to counting beans more accurately, they should.
Why has the number of citations grown so much?
When a book is printed or a paper is published in a journal or conference record, there are references to previous work on which the research is based. Today, counting these citations is easy. Web scrapers access the papers and accumulate data using simple natural language processing tools. You can see this at Google Scholar.
Type anything in the search bar, hit return and a list of papers will appear. Under the information about a paper, the number of citations appears. “Cited by 120” means that there are 120 other publications that include the paper in their list of references. For example, Google Scholar says that a paper co-authored by Albert Einstein, “Can quantum-mechanical description of physical reality be considered complete?”, has been referenced over 22,000 times.
Citation count has an impact in academia. It impacts professor hiring, raises, promotions, and tenure. There is an old saying that “the Dean can’t read but the Dean can count.” The use of bean counting quantity over research quality when assessing research has increased continuously. Citations impact this assessment. But, as Gary Smith notes, “Google Citations is a fast-and-easy (okay, lazy) way of assessing productivity and importance.”
An example of a measure based on citations is a journal’s impact factor, which is based on a count of how many times papers in the journal have been cited. Journals with papers that are cited a lot, it is reasoned, must be better that those with only a few citations. The theory is that if you publish in a journal with a high impact factor, your paper is high quality. This opinion is widespread but silly. A journal’s impact factor has nothing to do with the quality of your paper; it is simply an assessment of the company you keep.
Like the dollar during periods of high inflation, citations made today are losing their value. One of the forces behind citation inflation is the exponential explosion of publications. Consider a graph of publication number from the Web of Science from 1970 to 2020. An exponential fit, shown by the dashed line, shows that the number of publications has been doubling about every 18 years since 1970.
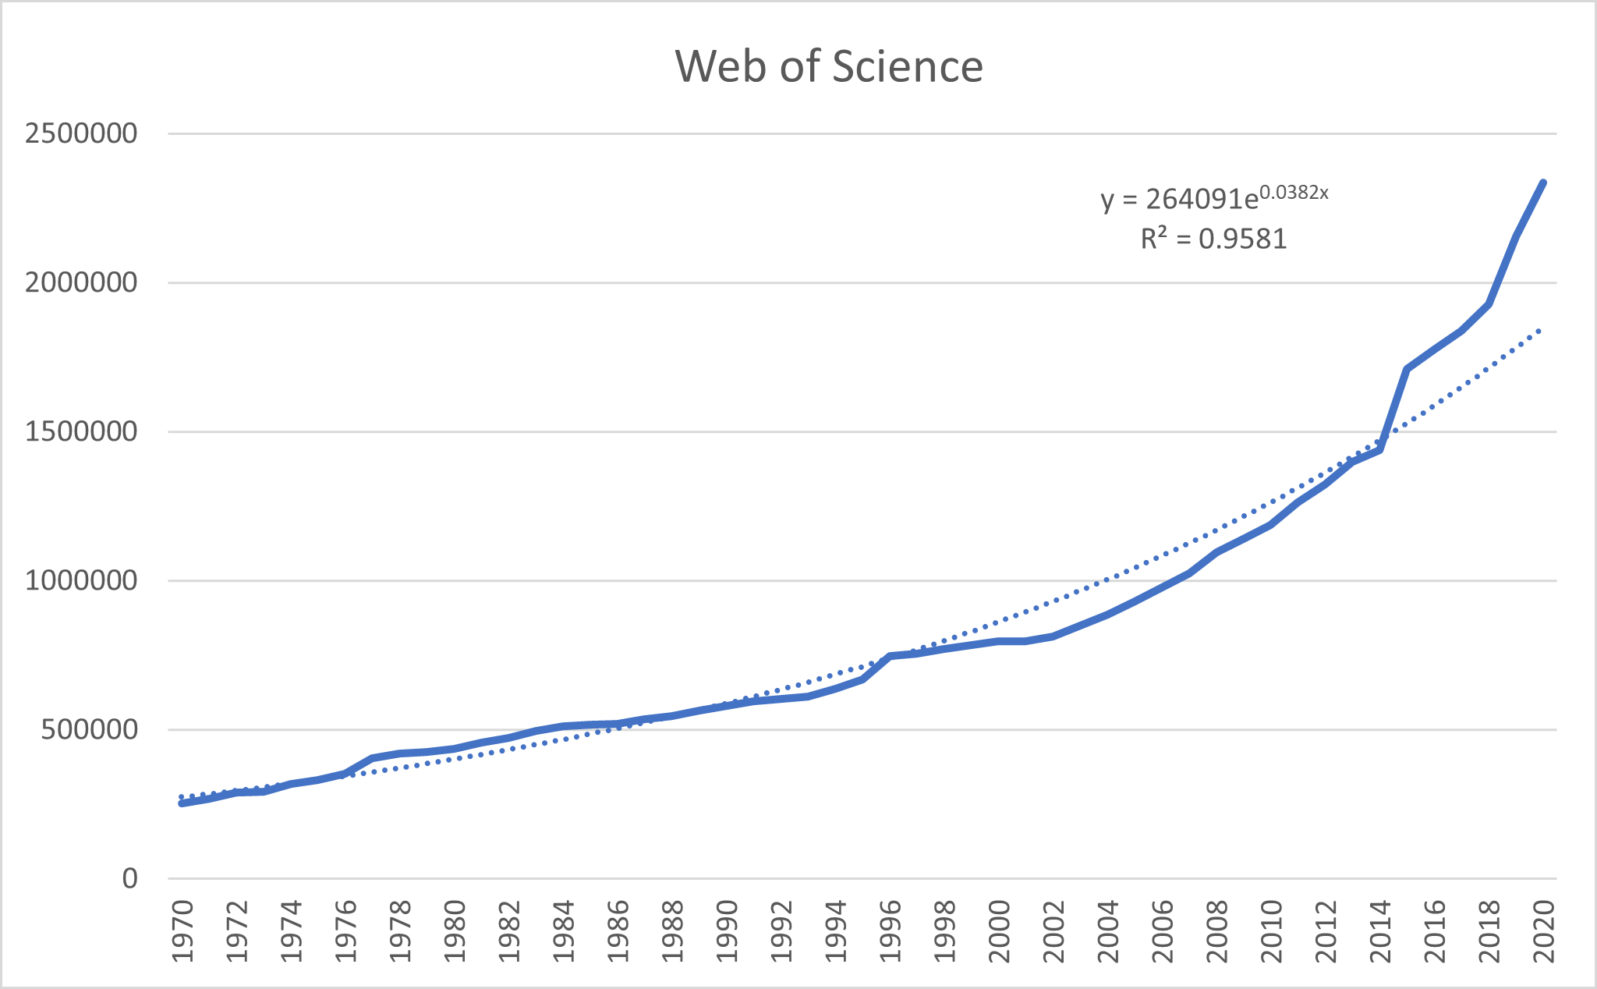
To adjust for inflation, assume that the number of citations per paper remains the same. Due, in part, to ease of searching for and inserting citations, this assumption is probably conservative. It allows us to adjust for citation inflation though.
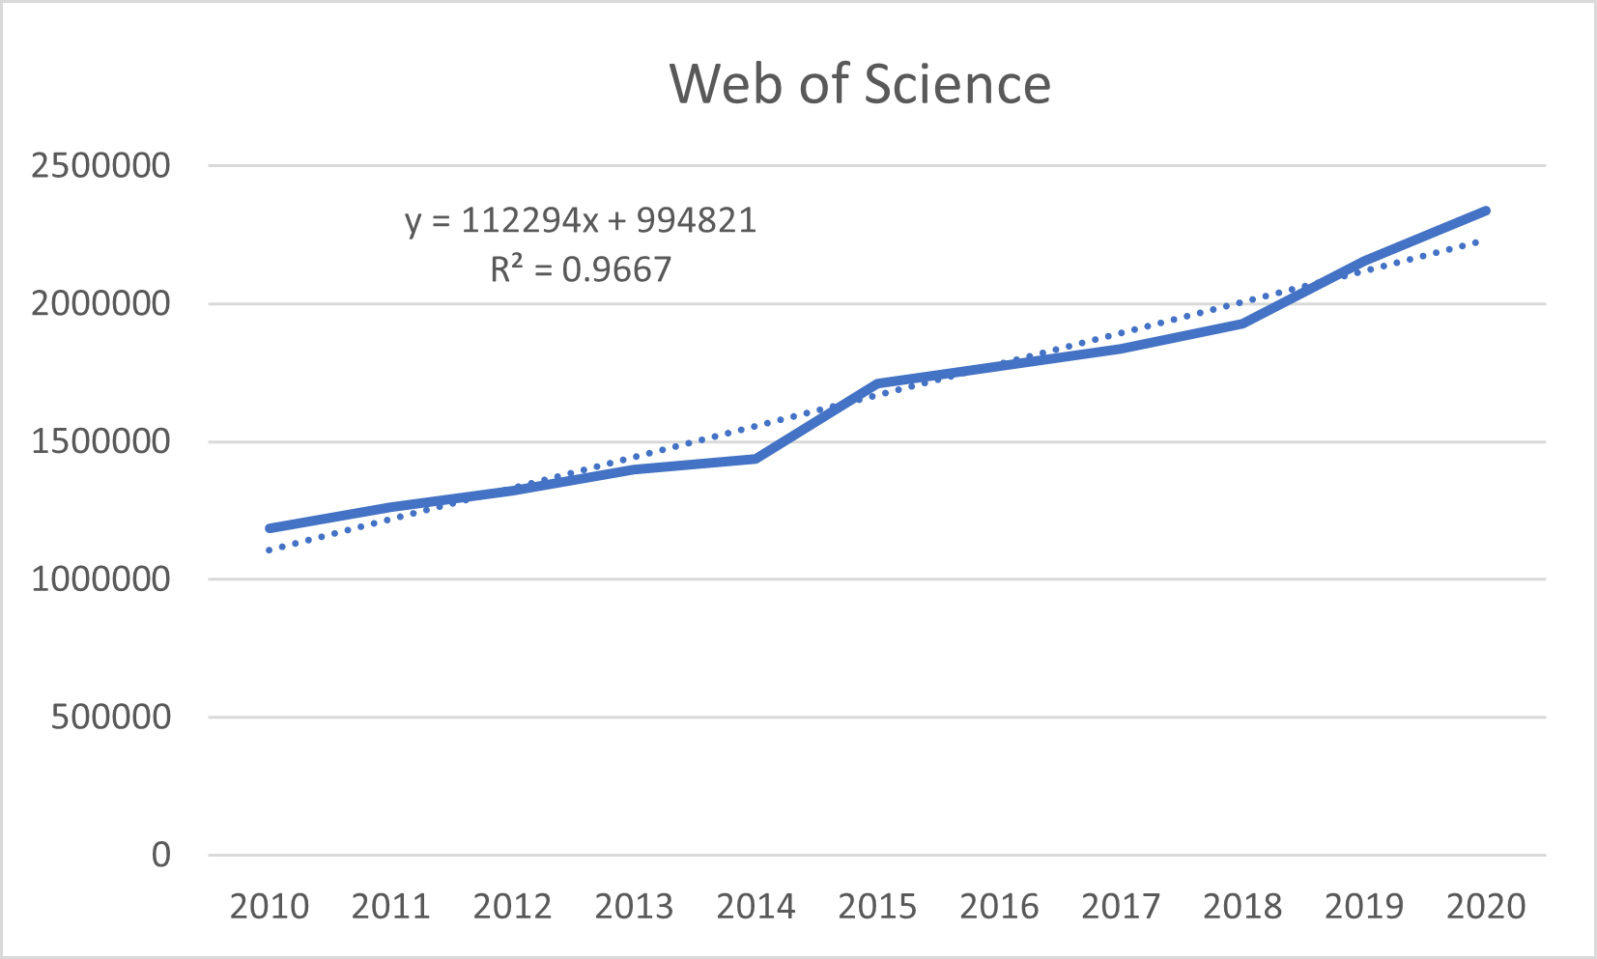
The rate of publication count has recently accelerated. Another graph of the same data over the most recent decade shows roughly a doubling of the number of publications. Adjusted for inflation, a citation today is worth about half what it was ten years ago.
There are a number of reasons for the growth in publications. One is how papers are published. It used to be that every publication was printed on paper. Not so anymore. In my field, conference papers often go directly onto the web. There is no hard copy. The method is easy and cheap. Another reason for the increase in publication count is that profs get rewarded for publishing a lot of papers. Remember: The Dean can’t read but the Dean can count. Professors often accumulate just enough research for a paper and then publish. Publications are often sliced into smallest publishable units giving rise to the phrase “salami science” that describes the process.
Writing citations into a paper is easier today than in the past. Go to Google Scholar, type something into the search bar, hit return and get a list of publications. Below each entry there is a “Cite” link. Click on that and you have the citation to the article in a drop-down menu. Just copy and paste it into your paper.
Citations need no longer be typed out one character at a time, the way I did when I was a boy. A large number of citations is desirable. It gives the impression that you are on top the field and know what you are talking about. Also, in the peer review process, chances are that the anonymous reviewers of your paper will have expertise in the field. A reviewer whose papers are not cited might feel dissed. This is the last thing you want to do to someone who is standing in judgment over your paper. So the prudent move is to reference liberally in hopes that you will cite an unknown reviewer’s work.
What happens when we adjust for citation inflation over time?
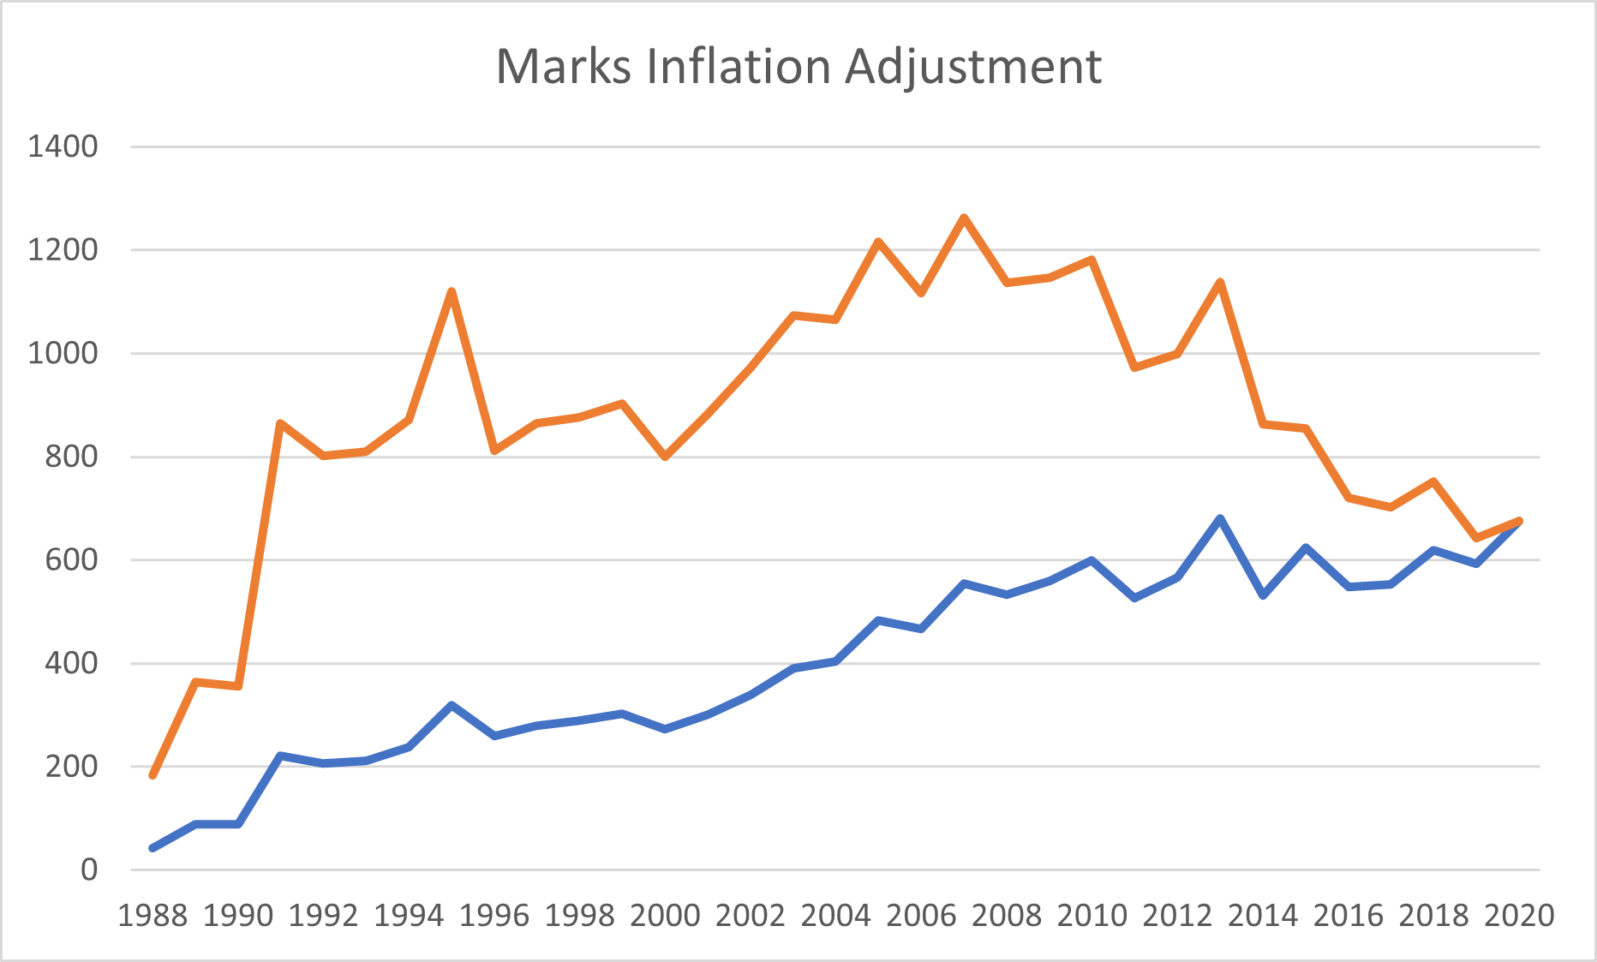
Google tracks an author’s publications and how many times they have been cited each year. Google Scholar’s list of my publications and their citations are listed here. On this Google Scholar page, there is a breakdown of how many citations I have each year. Using this data and the publication data used to generate the previous plots, my citations can be adjusted for citation inflation. When adjusted for inflation referenced to 2020, for example, my 43 citations in 1988 increases to 184 citations. A graph of my actual citations and inflation adjusted citations is shown. The total of number of lifetime citations I have through 2020 is 13,371. Adjusted for citation inflation, this count balloons to a bit over 29,000. This is more than double.
How citation inflation affects the h-index
Another performance metric based on citations is the h-index. If you have X papers that have been referenced X or more times, your h-index is X. Since I have 57 papers that have been cited 57 times or more, my h-index is 57. The h-index, as currently computed, does not take citation inflation into account. If it did, my h-index would be higher. Everyone’s would.
Take, for example, a paper I coauthored in 2005 titled “FPGA implementation of particle swarm optimization.” According to Google Scholar, it has been referenced 52 times. This is not enough to bump up my h-index which has a higher count of 57. But, when adjusted for citation inflation, the count for my 2005 paper increases to 92 citations and my h-index goes up!
To date, though, bean counters have not taken into account citation inflation in the calculation of the h-index. No one has.
Final thoughts
My analysis can be rightly criticized on many levels. Don’t older papers lose their significance over time? Sometimes but not always. How accurate is the assumption that the number of citations per paper remains about the same? My assumption certainly seems conservatively reasonable. Doesn’t the increase in publications thin the herd of papers that can be cited? For more recent publications, yes.
The bottom line is that using citations as a measure of quality, however you massage them, is fraught with problems. We haven’t even delved into citation quality. There are clumped citations where, for example, 24 or more citations are lumped together like “Artificial intelligence has found numerous applications [1-24].” Beyond the citation, there is no further comment made on these 24 papers.
Then there are substantive citations that discuss the merit of the citation. I have hundreds of publications. A few of them are good. One citation to my work [1] reads
“Cheung and Marks … give an elegant proof indicating this sub-optimality based on the fact that there are still band gaps“ [2]
The paper goes on to apply a technique I helped develop. This substantive citation to one of my good papers is more significant than a listing in a clumped citation.
All citations are not created equal — but bean counters weigh them as the same.
So what is the answer?
Spend more time tasting the beans instead of counting them. This is not easy. Interpreting citations is messy. Consider the near tautology: assessment of scholarship quality is qualitative. Not quantitative. In fairness to the Dean, fields today are so diverse that, in a given discipline, there is no way that Deans can understand all the papers their faculty write. Colleagues and outside experts need to weigh in on the quality of the work.
Doing so takes a lot more time and effort, but most things done well usually do.
References
There are deeper scholarly works dealing with paper and citation bean counting [3]. Extensive data is available.
Go to Google Scholar and search “Citation Inflation” and you can glean even more references.
- T.R. Gardos and R.M. Mersereau, “FIR filtering of images on a lattice with periodically deleted samples,” Proceedings of the International Conference on Acoustics, Speech and Signal Processing, Toronto, 1991
- K.F. Cheung and R.J. Marks II, “Image sampling below the Nyquist density without aliasing,” Journal of the Optical Society of America A, vol.7, pp. 92–105 (1990)
- Mike Thelwall and Pardeep Sud. “Scopus 1900–2020: Growth in articles, abstracts, countries, fields, and journals.” Quantitative Science Studies 3, no. 1 (2022): 37-50.