Introduction
Cognitive and adaptive radar transmitters must optimize for multiple priorities, including ambiguity-function (AF) performance of the amplifier's output waveform, power-added efficiency (PAE) of the transmitter power amplifier, and spectral mask compliance that may change based on surrounding wireless spectrum users. While significant progress has been made in the literature in the traditionally separate areas of radar waveform optimization and power amplifier circuit optimization, this paper demonstrates the joint optimization of both the waveform and the circuit to meet the following three goals:
AF performance;
PAE;
compliance with spectral regulations.
To our knowledge, this paper demonstrates the first successful joint circuit and waveform optimization for radar transmitters. PAE is defined by the following well-known equation:
![]()
Typically, efforts at radar waveform and circuit optimizations are performed independently, where the circuit is often optimized with no consideration of the waveform and vice versa. Gorji presents an iterative algorithm that adjusts the waveform parameters space-time adaptive weights to maximize the signal-to-interference-plus-noise ratio [1]. Consideration of the radar transmitter hardware's effect on a waveform optimization is introduced by Jakabosky [2]. Eustice performs radar waveform optimization using alternating projections for multiple constraints and objectives with a simple model used to represent the transmitter nonlinearities [3]. The feasibility of a reconfigurable radar is demonstrated through recent innovations in circuit optimization techniques [4], adaptive amplifier module construction [5], [6], and high-power tunable circuitry [7].
However, because the waveform affects the performance of the circuit and the circuit affects the performance of the waveform, it is expected that optimizing the nonlinear circuit and waveform together can improve the performance of both. In addition, joint optimization can provide gradual progress toward all objectives, rather than first achieving one goal and then attempting another, which often does not reach a solution that is a good compromise between all objectives. To our knowledge, this paper details the first complete algorithm for joint radar transmitter waveform and circuit optimization.
The function of a radar is to detect its target with desired range and Doppler resolution. The ambiguity in range and Doppler detection is represented by the AF, which was first derived by Woodward [9]. The AF is used to describe the output of the matched filter, based on the radar waveform ![]()
Eustice describes the AF and its derivation in more detail [11].
Waveform optimization techniques have been derived using the AF as a measure of the range and Doppler resolution performance achievable by the waveform. Wilcox presents a classic synthesis technique using a least-squares estimation approach to approximate a desired AF [12]. An extension of this work by Sussman allows functions without Hermitian symmetry and nonunity energy values [13]. Since real waveforms possess even magnitude spectra and odd phase spectra (Hermitian symmetry), the opening of the optimization to non-Hermitian waveforms allows complex waveforms to be used in the optimization. This, however, is reasonable, because the baseband waveform selected is upconverted onto a carrier frequency, which results in a real waveform from even a complex baseband waveform. Wolf considers AF synthesis using a pattern search with predetermined basis functions; however, only phase-modulated waveforms are considered [14]. Gladkova [15], [16] extends Wilcox's method to Hermite waveforms, which are often too difficult to generate [17], [18]. Costas focuses on obtaining an ideal “thumbtack” AF, with a sharp main lobe near the range/Doppler plane origin and no ambiguity elsewhere [19]. Patton has demonstrated joint optimization of the waveform and receiver signal processing to satisfy auto- and cross-correlation constraints [20], synthesis of a waveform based on its spectrum [21], and waveform optimization to satisfy autocorrelation and modulus requirements [22]. Kassab explores alternating projections for radar waveform synthesis based on the autocorrelation [23]. Blunt and Jakabosky demonstrate the implementation and optimization of polyphase-coded waveforms for radar [24], [25], and describe transmitter-in-the loop optimization for radar waveforms [2], [26].
Similarly, circuit optimization techniques have been developed that can be used for fast circuit tuning. Lu and Vaka-Heikkila discuss reconfigurable amplifiers using microelectrical mechanical systems switches [27], [28]. Deve describes a variable impedance matching network tunable between 1 and 3 GHz [29]. Sun describes the need for fast tuning with reconfigurable transmitters [30] and demonstrates real-time impedance matching for antennas using a genetic algorithm [31], [32]. Qiao demonstrates a real-time reconfigurable amplifier using a genetic algorithm [5]. While genetic algorithms have been used in some proposed real-time optimizations, Du Plessis discusses this approach and states that genetic algorithms tend to be slower than other algorithms in many applications [33]. Fellows [34] and Barkate [35] demonstrate modified gradient-based searches for power amplifiers. Bandler describes pattern and simplex searches as alternatives to the gradient search [36]. A simplex circuit search is demonstrated by Tsatsoulas [37], and Barkate compares pattern, simplex, and gradient searches in multidimensional circuit optimization, demonstrating that the gradient search approach is a very consistent approach for multidimensional optimization [38]. Gradient-based vector searches for radar power amplifiers have been demonstrated by Fellows [34], [4] and Barkate [35] allowing amplifier load-impedance optimization to maximize PAE while meeting requirements on adjacent-channel power ratio. Hays demonstrates the use of a varactor tuning network for fast reconfiguration designed for amplifier applications [39].
The impact of a nonlinear power amplifier on the radar waveform's AF is documented by Eustice [40]. In addition, the waveform's impact on circuit performance is evident based on the well-known relationships between peak-to-average power ratio (PAPR) and both efficiency and linearity for a given amplifier. These issues of intertwining impact make a joint circuit and waveform optimization approach very attractive. The need to provide a joint circuit and waveform optimization is presented by Baylis [41].
The present paper brings together the circuit and waveform optimizations and allows them to be performed in a back-and-forth manner. In transmission using nonlinear power amplifiers, the back-and-forth approach to circuit and waveform optimization is expected, in many cases, to provide a better overall solution than the individual optimization of the circuit followed by the individual optimization of the waveform (or vice versa). This is related to the general inability to apply the principle of superposition to nonlinear situations.
Section II describes the joint circuit and waveform optimization. Section III details the measurement setup. Section IV shows the measured results and how joint and sequential (circuit-then-waveform) optimizations compare. Section V provides conclusions and ideas for future work.
Circuit and Waveform Optimization Overview
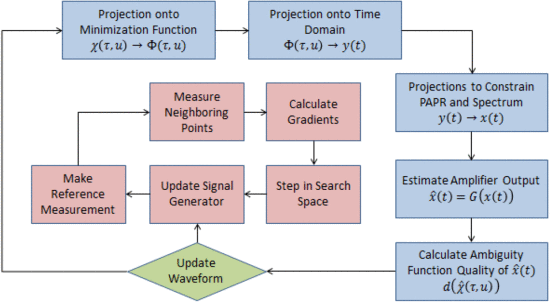
Fig. 1 illustrates the joint circuit and waveform optimization. The outer loop, containing boxes shaded in blue, is the Eustice alternating-projections waveform optimization [3]. The inner loop, containing boxes shaded in red, is a modified gradient-based circuit optimization adapted from Fellows [4]. The circuit is updated with the best performing waveform after every five waveform iterations. The timing of the optimization is that five waveform optimization iterations are performed, followed by a circuit optimization with the best performing waveform. This procedure then repeats until the optimization is halted.
We consider the following three goals for the overall optimization:
desired range/Doppler AF performance;
PAE maximization;
spectral compliance.
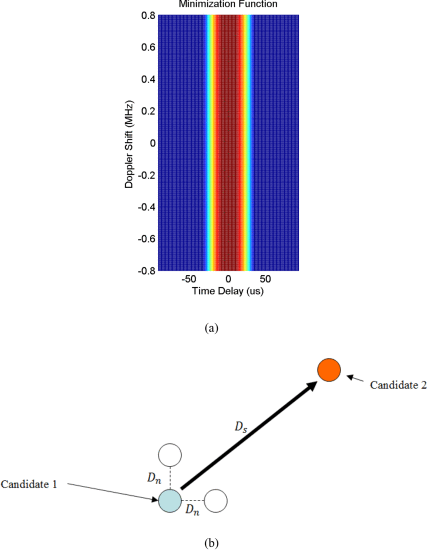
In the Eustice method of alternating projections waveform optimization (the outer loop in Fig. 1), the waveform is projected onto three sets [3]. The first set, called the minimization function, is shown in Fig. 2(a). The areas in blue are the range/Doppler combinations to be minimized. The minimization areas are given different levels of importance, as demonstrated through proceeding from dark blue to yellow in Fig. 2(a). The waveform is then projected onto a set of all waveforms that meet the peak-to-average-power ratio requirement. Last, the waveform is projected onto the set of spectrally compliant waveforms. Spectral mask compliance is determined by the value of the metric ![]()
(a) Ambiguity function minimization template showing areas of allowed ambiguity (red) and areas for ambiguity minimization (blue). (b) Gradient circuit optimization, using neighboring points at Candidate 1 to estimate the gradient, and taking a step of size
If
For the circuit optimization, in which the load reflection coefficient
As mentioned, the optimization sequence consists of five waveform optimizations, followed by a circuit optimization that uses the best available waveform, based on least-squares comparison to the AF template and spectral mask compliance. While the reverse process could be workable (the waveform could be updated with the best circuit setting every five circuit iterations), the results would likely take much longer to achieve, and potentially change significantly through the search. The best circuit setting heavily depends upon the best waveform, because the AF template significantly affects the closeness of the waveform to violation of spectral mask limitations. As such, it is best to ensure the waveform optimization moves along quickly in comparison with the circuit optimizations, to allow a near-final waveform to be achieved quickly. Additionally, a circuit optimization step takes significantly more time than a waveform optimization step, due to the time required for actuation and movement of the impedance tuner.
Measurement Setup
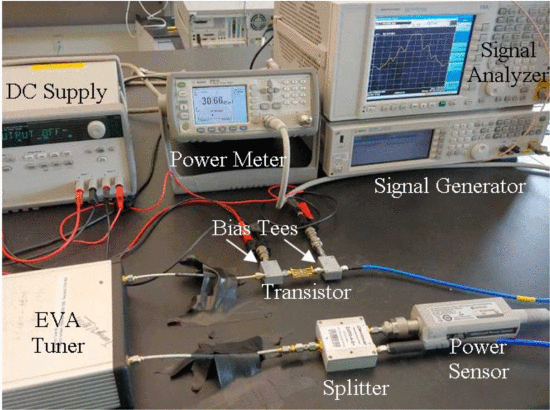
The optimizations were run on a test bench setup controlled by MATLAB, which controls a Maury Microwave load pull tuner and a Keysight Technologies signal generator. Our measurement setup for demonstration of impedance tuning algorithms is shown in Fig. 3. For the initial experiments described in this paper, the Maury tuner was used in place of an actual reconfigurable circuit to demonstrate the effect of adapting the load impedance using search algorithms. The developments presented in this paper will be later investigated in reconfigurable amplifiers for real-time performance. Measurements are read from a Keysight Technologies signal analyzer and power sensor. The optimizations were measurement-tested on two different amplifier devices: a Microwave Technologies (MWT) High Gain GaAs FET and a Skyworks InGaP packaged amplifier. The optimizations were performed from starting ![]()
Measurement setup (Maury mechanical tuner is used in place of “EVA Tuner” for this work).
After the initialization, five iterations of simulated waveform optimization were performed using the controlling computer. Sequential optimization first performs the entire circuit optimization using the approach of Baylis [8], where the gradient-based approach is used to find the load reflection coefficient (
Joint optimization operates differently than sequential optimization. Instead of doing circuit optimization followed by waveform optimization, the two optimizations are performed in an alternating manner (five waveform iterations followed by one circuit optimization) to approximate parallel circuit and waveform optimization. As in the case of sequential optimization, the process begins with five simulated waveform iterations. The measurement optimization begins with five waveform iterations, then the circuit optimization uses the waveform with the lowest least-squares distance to perform the circuit optimization. The next five waveform optimization iterations are then performed. This process continues until a total of 40 waveform iterations have been completed (including simulated and measured waveforms). After 40 waveform iterations have been performed, the circuit search runs until convergence. From the final
In presenting plots of the optimization versus iterations, the unit of “equivalent waveform iterations” is used. It is reasonably anticipated that a measurement-based circuit optimization iteration will require approximately five times as much time as a circuit optimization, due to the time it takes to move the tuners to a new
A range radar minimization function was used for these experiments, minimizing the ambiguity everywhere in the range/Doppler plane except for along the Doppler axis [Fig. 2(a)]. With a range radar, the waveform optimization yields a short pulse in the time domain, which corresponds to a near constant in the frequency domain. However, since the spectral mask does not allow this, the optimization is forced to select a waveform that is as close as possible to the range radar minimization function while meeting spectral requirements. The PAPR limit is often approached as well by the pulse-like time domain waveforms producing good range resolution. This, in turn, results in lower PAE.
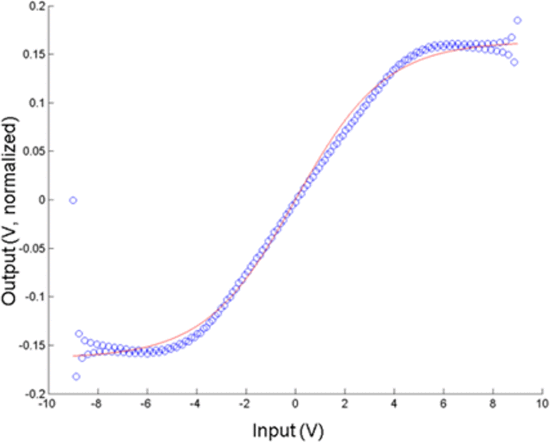
It is the transmitter amplifier output waveform that should be examined in a radar waveform optimization. An input waveform is synthesized that is expected to produce the desired output waveform, based on a simple model for amplifier nonlinearities. This model is used to provide the input waveform that, given the amplifier nonlinearities, can produce the desired output waveform. For purposes of this initial work, a simple hyperbolic tangent model is used to model the input–output voltage response of the amplifier [11]. The model is defined as follows:
![]()
The model coefficients
Measured input–output data (blue circles) and model simulation results (red line). This nonlinearity model allows for input waveform synthesis based on a desired output waveform.
Measurement Results
Traditional methods of finding the maximum-PAE
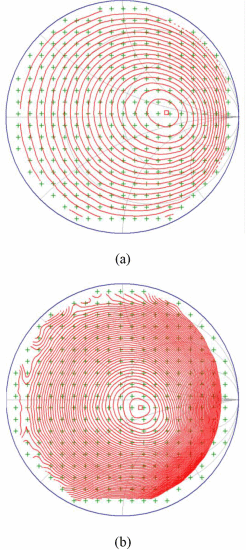
PAE load-pull comparison. (a) Load-pull for the MWT amplifier, showing the maximum PAE point, indicated by the red square. (b) Load-pull for the Skyworks amplifier, showing the maximum PAE point, indicated by the red square.
Table I shows the average results for both joint and sequential (circuit first, then waveform) optimization using both the MWT and the Skyworks (SKY) devices. On average, joint optimization results in a higher PAE than sequential optimization. This is because joint optimization is able to take advantage of the tradeoff that exists between the circuit and the waveform. The standard deviation (
Even though the starting exponential waveform has a duty cycle of 100%, the final waveform does not. The given ambiguity minimization function tends to cause very short-burst waveforms for good range detection, leading to a waveform that typically has a duty cycle of 10 to 15%. Since the PAE is calculated over one whole period, the substantial amount of off time decreases PAE because the dc bias power is still being used. To increase efficiency in practice, the bias power can be turned off during the waveform “off” times once the optimization has settled in on a repeatable waveform. This can be performed using envelope tracking techniques, for example. This will boost the efficiency by the factor of duty-cycle decrease, but is not performed in the experiments detailed in this paper.
Table I also shows the spectral mask compliance, indicated by the metric
The waveform least-squares distance from the ambiguity minimization function is also shown in Table I. A least-squares distance of 1.0 would indicate that the AF did not look anything like the minimization function. A least squares distance of 0.0 would indicate that the AF looked exactly like the minimization function. As shown in Table I, both joint and sequential optimizations produce a waveform that matches the AF template well. Since both optimizations perform approximately the same number of waveform iterations, a similar least squares distance is expected.
Table I also shows the average final reflection coefficient (
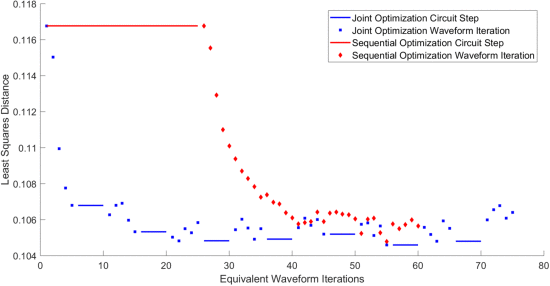
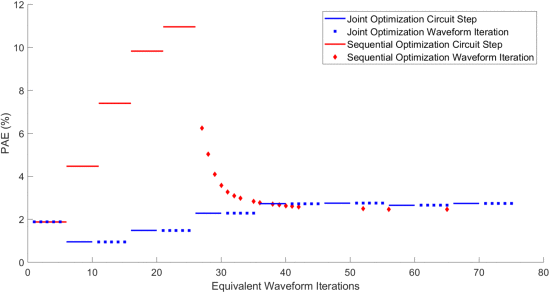
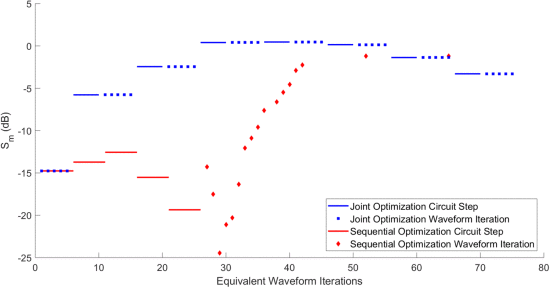
While Table I allows for comparison of the end result of the optimizations, it is the ability of the intermediate states in the optimization to provide a good compromise between PAE and waveform performance that demonstrates the true value of joint optimization. A comparison of the least squares distance for joint and sequential optimizations versus equivalent waveform iterations is shown in Fig. 6. The PAE values for joint and sequential optimizations are compared in Fig. 7. The spectral mask compliance metric
Comparison of least-squares distances between the actual waveform ambiguity function and the ambiguity function template for joint (blue) and sequential (red) optimizations for the Skyworks amplifier with starting
Comparison of PAE for joint (blue) and sequential (red) optimizations for the Skyworks amplifier with starting
Comparison of
When examining sequential optimization, the circuit optimization took 25 equivalent waveform iterations to complete, which is equivalent to five circuit steps. These circuit steps were taken using the starting exponential waveform, which has a least squares distance of 0.1168. After the circuit optimization converged at iteration 25, waveform optimization was performed from the final
For joint optimization, the circuit and waveform optimizations are completed in a back-and-forth approach. The first five waveforms, not shown in the plots, were completed in a simulation environment, as in the case of the sequential optimization. Next, beginning with equivalent waveform iteration 1, five waveform iterations were completed on the measurement setup. At this point, a circuit step was taken using the waveform with the lowest least squares distance from the previous five waveform iterations. Because the waveform changes as the
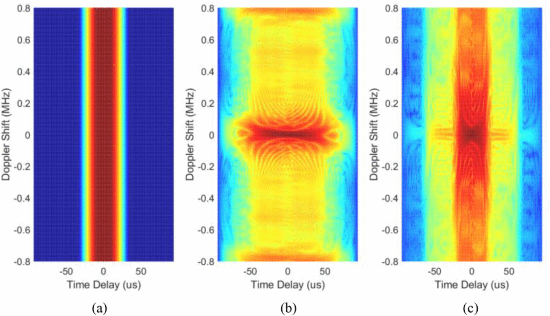
The strength of joint optimization comes from how quickly it is able to produce a usable result. In integrating with a cognitive radar optimization, it may be necessary to operate successfully without having the full time to complete an optimization. Since joint optimization immediately starts improving the waveform, the waveform is usable much earlier than with sequential optimization. As shown in Fig. 6, by equivalent waveform iteration 26, joint optimization has found a waveform that is usable and is much better than sequential optimization. A comparison of the AF from sequential and joint optimizations with the minimization function is shown in Fig. 9. The joint optimization AF [Fig. 9(c)], looks much like the range template of Fig. 9(a), with the ambiguity aligned along the Doppler axis. The sequential optimization ambiguity function actually aligns much of its ambiguity along the range axis, preventing high-resolution range detection at this stage of the optimization.
Ambiguity function comparison at equivalent waveform iteration 26 including (a) ambiguity function minimization template, (b) ambiguity function from sequential optimization, and (c) ambiguity function from joint optimization.
Fig. 7 shows that for sequential optimization, circuit optimization continues to increase the PAE with a nonrange waveform until it reaches the maximum, which is around 11%. This is close to the maximum PAE that the Skyworks amplifier is able to achieve. After five circuit steps, the search converges, and the waveform optimization begins. For the waveform optimization, the PAE immediately starts decreasing. This is because the range radar template results in an optimized waveform with a low duty cycle (approximately 10%). This therefore decreases the efficiency of the waveform, as the waveform is instead being limited by the peak-to-average-power ratio, which is used as a constraint in the waveform optimization to maintain useful PAE. In addition, since the waveform optimization does not attempt to improve the PAE, these measurements were not originally coded to be read from the test setup during waveform optimization. Instead, the PAE and
Joint optimization again takes slightly longer to complete than sequential optimization. Since joint optimization begins with waveform optimization at the starting
As the joint optimization continues, the PAE continues to increase until equivalent waveform iteration 35, where the values begin to peak. From this point, the waveform continues to be optimized, leading to waveforms that better meet all parameters. By the end of the search, joint optimization yields a higher PAE value that demonstrates a good tradeoff between circuit and waveform parameters, with the final
The unfolding of spectral compliance versus equivalent waveform iteration is shown in Fig. 8. Sequential optimization starts with circuit optimization. Since the starting waveform has a narrow bandwidth, it results in high PAE and low
Unlike sequential optimization, joint optimization starts with a set of waveform iterations. As with PAE, the same
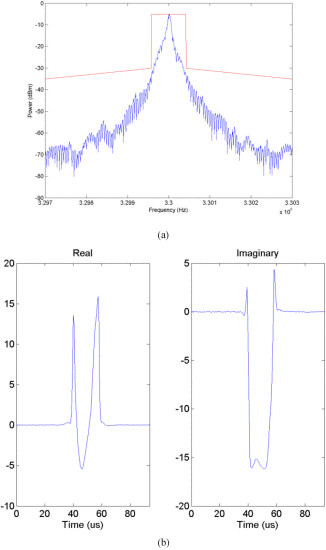
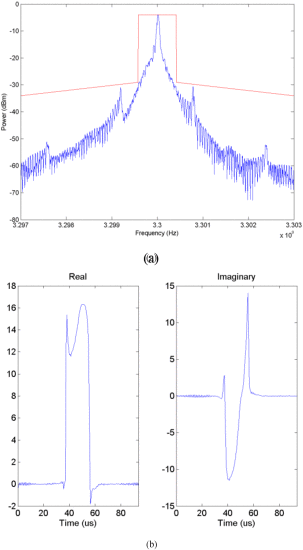
The final waveforms for joint and sequential optimization for the Skyworks amplifier (from the searches shown in Figs. 6–8) are shown in Figs. 10 and 11, respectively. In both cases, the equivalent baseband waveform is a short burst in the time domain, an attribute expected of a range-radar waveform. This results in a spectrum that is close to the mask constraints, as seen for both the joint (Fig. 10) and sequential (Fig. 11) searches.
Final waveform resulting from joint optimization of Skyworks amplifier. (a) Final spectrum. (b) Real and imaginary parts of the baseband time-domain waveform.
Final waveform resulting from sequential optimization of Skyworks amplifier. (a) Final spectrum. (b) Real and imaginary parts of the baseband time-domain waveform.
Conclusion
A joint circuit and waveform optimization has been explored and is seen to produce useful results quicker than sequential optimization in which the amplifier load reflection coefficient is first completely optimized, followed by the waveform. Measurement results show that both joint and sequential optimizations produce waveforms with a similar least squares distance, while joint optimization yields a slightly higher PAE on average. The true usefulness of the joint optimization approach is based on the fact that the circuit and waveform alternatingly change slightly, allowing both a useful radar waveform for the given AF template and reasonable PAE to be simultaneously obtained more quickly than in a sequential optimization where the circuit and waveform are individually completely optimized. Because next-generation radars will operate in dynamic environments, various parameters—including operating frequency, bandwidth, and power—will change in real time. Thus, a real-time back-and-forth optimization will help to adjust parameters without the need to restart an optimization from the beginning. Additionally, if mechanically actuated reconfigurable circuits, such as those presented by Semnani [7], are used in the optimization, the reconfiguration time will likely exceed the pulse repetition interval and perhaps even the coherent processing interval of a radar. As such, the radar must be able to perform high-resolution detection while the joint optimization is performing. The demonstrated ability to get reasonable performance in all three criteria—AF, PAE, and spectral-mask compliance—during the joint optimization, as opposed to a situation where only one or two of these criteria perform well in a traditional sequential optimization, is critical to avoiding the need for radar “down time” while the circuit and waveform are reoptimizing.
ACKNOWLEDGMENT
The authors are grateful to E. Mokole for his helpful ideas concerning this work.

