Abstract: Reconfigurable transmitter power amplifiers will be necessary in future cognitive radar systems to allow adjustment in operating frequency, spectral output, and other des... View more
Abstract:
Reconfigurable transmitter power amplifiers will be necessary in future cognitive radar systems to allow adjustment in operating frequency, spectral output, and other desired operating characteristics while maintaining performance. Circuit optimization algorithms for tuning the amplifier load impedance and bias voltage in real time should maximize power-added efficiency while limiting the adjacent-channel power ratio (ACPR) in order to obtain spectral compliance. This paper presents a fast vector-based three-dimensional optimization for simultaneous bias adjustment and impedance matching for these goals using the bias Smith tube as the optimization space. Simulation and measurement results are presented for this optimization algorithm, and correspondence between the results is examined for several different starting locations in the bias Smith tube. This algorithm will allow simultaneous optimization of bias voltage and load impedance in real time in order to meet changing requirements.
Published in: IEEE Transactions on Aerospace and Electronic Systems ( Volume: 55 , Issue: 1 , Feb. 2019 )
Page(s): 182 - 191
Date of Publication: 13 July 2018
ISSN Information:
Publisher: IEEE
Funding Agency:

SECTION I.

Introduction

Future adaptive radar transmitters will need the ability to dynamically reconfigure in order to share the frequency spectrum more effectively without sacrificing transmitter power efficiency. The concept of adaptive radar has existed for several decades [1][4], but more recent work shows that adaptive radar technology is moving from theory to reality. A similar technology called cognitive radar has also been proposed. While adaptive radar systems adjust designs in real time for changing requirements, cognitive radar systems additionally learn from and respond to their environment [5], [6].

The use of adaptive and cognitive radars in sharing of the frequency spectrum in real time is a significantly challenging effort. Collaborative efforts between radar and communications using cognitive radio technology are beginning to emerge [7]. A recent paper discusses the concept of joint circuit and waveform codesign as a significant challenge problem facing radar operators [8]. This allows the intertwined impact of the circuit and the waveform to be jointly considered. Circuit optimizations and waveform optimizations should be designed to operate simultaneously in real time. Patton demonstrates the joint optimization of the waveform and receiver's matched filtering for autocorrelation and cross-correlation constraints [9], synthesis of a waveform based on a desired spectrum [10], and waveform optimization to meet constraints on both the autocorrelation and the waveform amplitude [11]. Jakabosky describes optimization of radar waveforms with the transmitter hardware “in the loop” to overcome the tradeoff of distortion versus transmission efficiency [12], and Ryan and Blunt demonstrate the hardware-in-the-loop optimization of polyphase-coded frequency-modulation waveforms using a linear amplification with nonlinear components power-amplifier architecture [13], [14]. Techniques for real-time circuit optimization that can be used in conjunction with waveform optimization techniques have also been recently introduced to the radar community. Real-time optimization of load impedance in a radar transmitter will require a variable matching circuit [15], [16]. Kingsley and Guerci have discussed implementation of a matching network for adaptive radar [15]. The literature shows that tuning of some matching circuits can be achieved in microseconds, which is fast enough for real-time optimization purposes. Previous works by the authors have presented algorithms for fast circuit tuning, including the ability to tune the load reflection coefficient presented to an amplifier to maximize the power-added efficiency (PAE) under constraints on the adjacent-channel power ratio (ACPR), using the Smith chart as a search space [17], [18]. ACPR and PAE are both significantly dependent on load impedance [19]. Instead of the ACPR, the circuit optimization can be performed specifically to require spectral mask compliance [20]. Our development of the Smith tube, a multidimensional optimization space, has allowed additional parameters to be modified in the optimization, including waveform bandwidth [21] and input power [22]. In addition, the optimization can include additional constraints, such as requiring the output power to be above a specified minimum value [23].

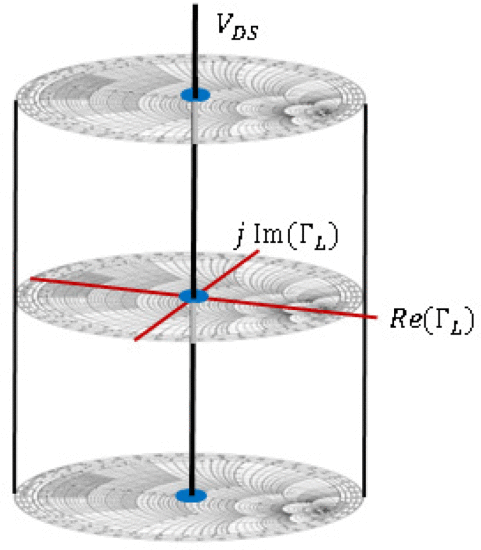
The purpose of this paper is to demonstrate a joint optimization of the power-amplifier matching circuit impedance and an amplifier device bias voltage to maximize the efficiency of the amplifier while remaining within constraints on the ACPR. Our work builds on the following previous innovations from the literature: 1) PAE and ACPR dependence on load impedance and bias and 2) fast algorithms for circuit optimization. The need for joint circuit and bias optimization is developed by several works that show the dependence of PAE and ACPR on bias voltage and impedance. This literature includes applications such as envelope modulation of gate voltage [24], adjusting drain voltage and current to improve PAE [25], variation of input and output bias voltages [26], optimizing bias and RF power for efficiency while examining drain voltage and RF input [27], and using a dc–dc converter to simultaneously optimize input waveform and dc voltage [28]. Other literature shows how load resistance impacts bias point and power efficiency [29], how the optimum load impedances for power and efficiency vary with bias voltage on the Smith chart [30], how optimum PAE varies with bias [31], and how to select matching circuit impedance and bias voltage for ideal peaking and carrier performance using Doherty amplifiers [32]. Recent work by the authors has introduced the bias Smith tube, which is a three-dimensional extension of the Smith chart where the vertical dimension is drain voltage [33]. The bias Smith tube is shown in Fig. 1.

Figure 1
Fig. 1.

Bias Smith tube. The vertical axis represents a bias voltage (drain–source voltage VDS in this case), while the horizontal cross section of the tube is a conventional Smith chart [33].

Several circuit optimization techniques have been developed in the literature. Sun and Lau implement a genetic algorithm for antenna matching based on VSWR requirements [34], [35]. Qiao also uses a genetic algorithm for a reconfigurable amplifier [36]. However, genetic algorithms can be slower than other algorithm types for certain impedance-matching applications [37]. Balachandran demonstrates the application of the sequential unconstrained minimization technique and the automated Lagrangian penalty function technique in designing a power converter [38]. The constrained optimization for PAE while meeting ACPR requirements is an example of an optimization involving more than one objective. The literature describes several methods for optimizing in multi-objective situations [39][44].

The rest of this paper describes the presented algorithm and shows simulation and measurement results of algorithm testing. Section II describes the bias Smith tube search algorithm in detail. Section III shows simulation results for this algorithm. Section IV shows measurement results for this algorithm. Section V provides some conclusions and suggestions for future work.

SECTION II.

Algorithm Description

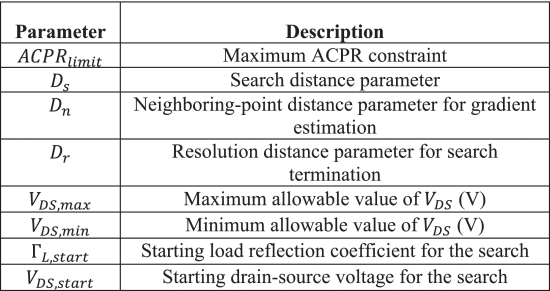
The presented algorithm simultaneously optimizes the load reflection coefficient ΓL with a device bias voltage in the bias Smith tube. It starts from a user-specified location in the bias Smith tube and uses a vector-based approach to find the maximum PAE value that can be obtained within a user-defined ACPR limit. In addition to the ACPR limit, the algorithm requires a few other user inputs. The user must provide the value for the step size parameter Ds, which is used in calculating the magnitudes of all steps the search will take. Additionally, the user must define the resolution distance Dr, as well as the neighboring-point distance Dn used for estimating the gradient near a candidate point. When the magnitude of the search vector decreases below Dr, the search is stopped. Third, the user must provide minimum and maximum drain voltages to be considered by the algorithm. Finally, the user must provide the values of ΓL and voltage VDS to serve as the start location for the algorithm in the Smith tube. The input parameters and their descriptions are summarized in Table I.

TABLE I Algorithm Input Parameters
Table

Once those inputs have been defined, the VDS values are normalized between −1 and 1 using the following equation:

vDS=2VDSVDS,minVDS,maxVds,min1(1)
View SourceRight-click on figure for MathML and additional features.where vDS is the normalized drain voltage, VDS is the drain voltage, VDS,min is the minimum drain voltage to be considered by the algorithm, and VDS,max is the maximum drain voltage to be considered by the algorithm. Normalizing the VDS values establishes the top and bottom of the Smith tube while also causing the vertical dimension of the Smith tube to have the same scale (going from −1 to 1) as the horizontal dimension (load reflection coefficient ΓL on the Smith chart), which is normalized according to the well-known equation zL=ZL/Z0, where zL is the normalized load impedance, ZL is the load impedance, and Z0 is the reference impedance.

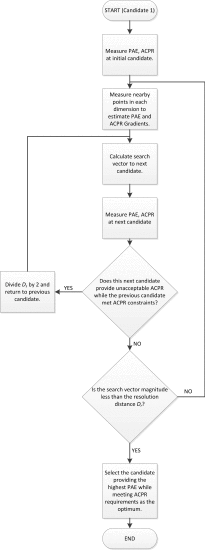
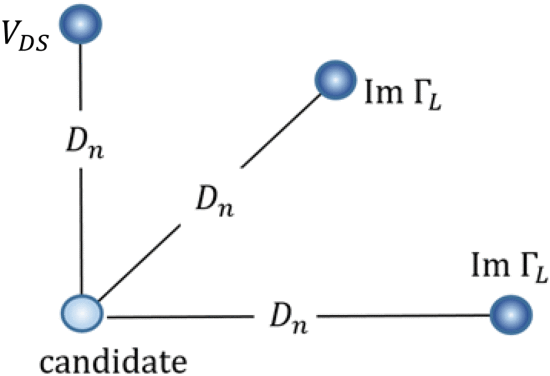
A flowchart describing the basic progression of the algorithm is shown in Fig. 2. After the algorithm normalizes the VDS values, it starts taking measurements at the user-specified start location. The algorithm takes a measurement at that candidate location and at three neighboring points separated from the initial point by neighboring-point distance Dn in each dimension of the search, as shown in Fig. 3. These measurements are then used to estimate gradients in order to determine the direction of steepest descent for the ACPR (represented in equations by a^) and the direction of steepest ascent for PAE (represented in equations by p^). Based on those measurements, the search will then calculate a step vector, which depends on where the candidate lies in the Smith tube.

Figure 2
Fig. 2.

Bias Smith tube search algorithm flowchart.

Figure 3
Fig. 3.

Measured ΓL points for PAE and ACPR gradient estimation at a candidate. Points are measured separated from the candidate by neighboring-point distance Dn in all three coordinate directions.

Unit vectors a^ and p^ are estimated in the optimal PAE and ACPR, based on the approximations of the gradients. If the PAE is represented by p, then the PAE gradient is given by p:

p =Γ^r pΓr+Γ^ipΓi+v^DSpvDS.(2)
View SourceRight-click on figure for MathML and additional features.

The partial derivatives in (2) are approximated as follows, where Δp in each case represents the change in p when the associated step is taken in the bias Smith tube:

pΓrpΓipvDSΔpΔΓr=ΔpDn.ΔpΔΓi=ΔpDn.ΔpΔvDS=ΔpDn.(3)(4)(5)
View SourceRight-click on figure for MathML and additional features.

The unit vector in the direction of PAE steepest ascent is calculated using a gradient estimation:

 p^=p|p|.(6)
View SourceRight-click on figure for MathML and additional features.

The ACPR gradient a, where a is used to represent the ACPR, is estimated using the same approach as outlined in (2)–(6), with a replacing p. A unit vector a^ is defined in the optimal direction of ACPR travel, which is opposite to the gradient, because the ACPR improves as it grows smaller. Thus, a^ is given in the direction of ACPR steepest descent:

 a^=a|a|.(7)
View SourceRight-click on figure for MathML and additional features.

A unit vector b^ bisecting a^ and p^ is estimated:

 b^=12 (a^+p^).(8)
View SourceRight-click on figure for MathML and additional features.

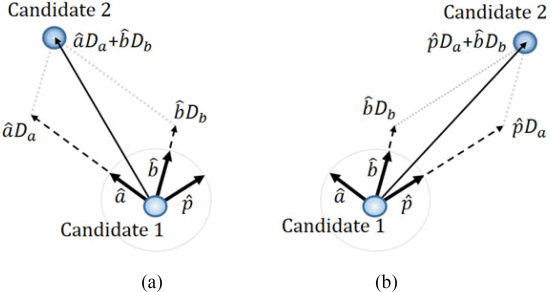
If the measurement at the current candidate location gives an ACPR that was greater than the ACPR limit (out of compliance), then the step vector is defined by

 v¯=a^ Da+b^Db(9)
View SourceRight-click on figure for MathML and additional features.where
DaDb=Ds2 |ACPRcandACPRlimit||ACPRworstACPRlimit|,=Ds2 |θ90|90.(10)(11)
View SourceRight-click on figure for MathML and additional features.

This search vector construction is shown in Fig. 4(a). ACPRcand is the measured ACPR at the candidate location, ACPRlimit is the user-defined ACPR limit, and ACPRworst is the measured ACPR value that is farthest from the ACPR limit. Note that Da=0 if the ACPR at the candidate is equal to the ACPR limit. In (13), θ is the value of the bisector angle between a^ and p^. Note that Db=0 if the bisector angle is equal to 90. If θ=90, the ACPR and PAE contours are collinear, which means that any location with θ=90 will have the maximum PAE value for some ACPR limit (assuming convex contours). The collection of all points with θ=90 forms the Pareto optimum locus [17].

Figure 4
Fig. 4.

Search vectors in the Smith tube in the cases where (a) candidate 1 ACPR is outside the ACPR limit and (b) candidate 1 ACPR is inside the ACPR limit.

The ACPR contours may not always be convex; however, the authors have observed that the ACPR contours are usually close enough to being convex in the regions near the desired optimum for the search algorithm to provide a consistent quality of results for all start locations in the Smith tube. Since (3) goes to zero on the ACPR limit contour and (4) goes to zero on the Pareto front, the vector addition in (2) should converge to the desired optimum.

A second possibility based on a candidate measurement is that the ACPR at the candidate will be less than or equal to the ACPR limit, which means that the present candidate is in spectral compliance. In that case, the next step, which the algorithm takes, is defined by

v¯=p^ Da+b^Db.(12)
View SourceRight-click on figure for MathML and additional features.

The only difference between (12) and (9) is that the vector in (12) has a component in the direction of steepest ascent for PAE, whereas the vector in (9) has a component in the direction of steepest descent for the ACPR. This difference recognizes which of those two parameters needs improvement. If the ACPR limit is being met then the algorithm tries to improve PAE. If the ACPR limit is not being met then the algorithm tries to improve the ACPR. Also note that Da and Db in (12) are the same as in (9), which means that (12) and (9) will both converge to the desired optimum location. Fig. 4(b) shows a representation of the step the search will take in this case.

Before the algorithm can use the calculated step vector, it must first check to make sure that the new candidate location is still inside the Smith tube. If not, the algorithm chooses the closest location to the calculated point that is inside the Smith tube to be the next candidate point. The algorithm then moves to take a measurement at the new location and performs the following checks.

  1. The step to a new candidate point is allowed to leave the ACPR acceptable region one time. After the first time, if the step took the search from a candidate inside the ACPR acceptable region to a candidate outside the ACPR acceptable region, divide the search distance parameter Ds by 2 and recalculate the step. This forces the algorithm to converge to an optimum even if the user-chosen Ds value is too large for (9) and (12) to decrease naturally below the resolution distance Dr.

  2. If both the new candidate and the old candidate are inside the ACPR acceptable region, but the PAE at the new candidate is lower (worse) than the PAE at the old candidate, divide Ds by 2 and recalculate the step. This allows the algorithm to still converge to the constrained optimum in the case where the global PAE maximum is inside the ACPR acceptable region.

The presented search algorithm repeats the process of candidate measurements and steps to new candidates until the magnitude of the step vector v¯ is less than the user-defined resolution distance Dr. When that happens, the algorithm takes its last candidate measurement and then chooses the measured point with the maximum PAE within the ACPR limit as the optimum point. This point is the combination of bias voltage and ΓL that provides the constrained optimum PAE.

SECTION III.

Simulation Results

The presented algorithm was tested in simulation using the Advanced Design System (ADS) software from Keysight Technologies. In ADS, a Modelithics model of a Qorvo TGF2960 field-effect transistor was used. The search used an ACPR limit of −49 dBc and was tested from a total of 50 different start locations in the Smith tube. Simulations were performed using a CDMA2000 excitation waveform at a fixed center frequency of 3.3 GHz, input power Pin=9 dBm, and gate voltage VGS = 0.9 V. The drain voltage VDS was allowed to vary between 2 and 12 V.

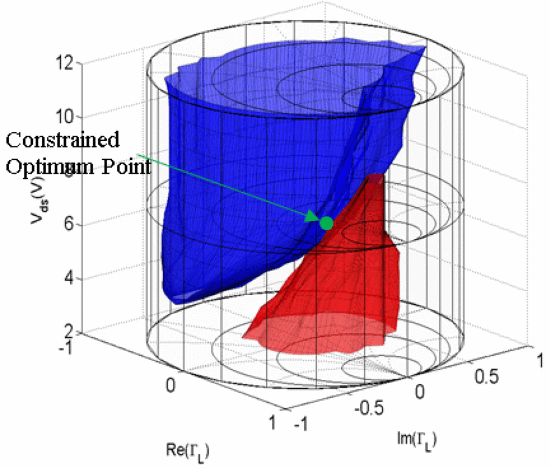
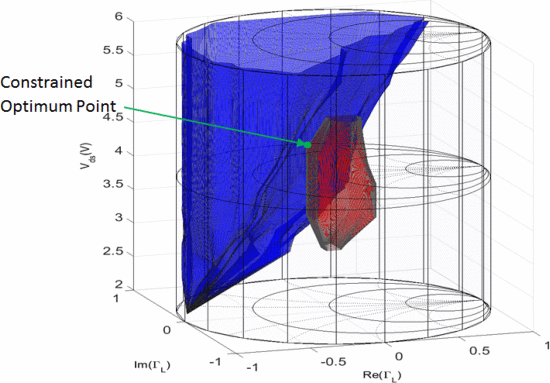
Fig. 5 shows the surface representing ACPR = −49 dBc and the surface representing PAE = 33.04%, which represents the largest PAE value that can be obtained within that ACPR limit. The point where the two surfaces intersect in that figure represents the optimum operating point as found by a brute force examination of the entire Smith tube, which requires hundreds of simulated points, taken by multiple load-pull simulations at varying VDS values. The goal of the presented optimization algorithm is to avoid the necessity for this exhaustive measurement performance and find the optimum operating point as quickly as possible.

Figure 5
Fig. 5.

Surface for ACPR = −49 dBc (blue) and surface with PAE = 33.04% (red) from simulations. The constrained optimum point is ΓL= 0.2/90°, VDS = 6 V.

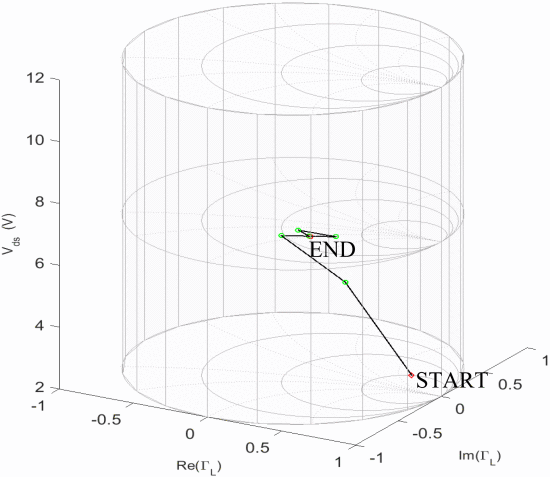
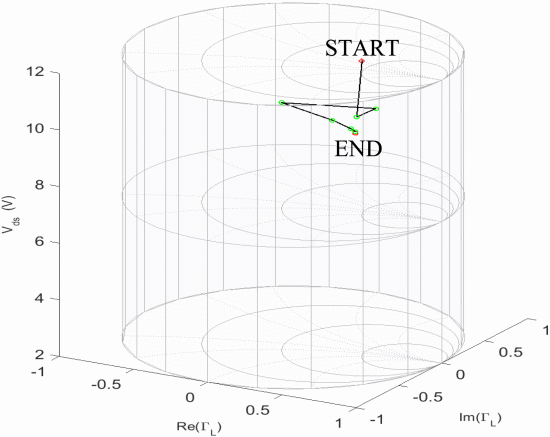
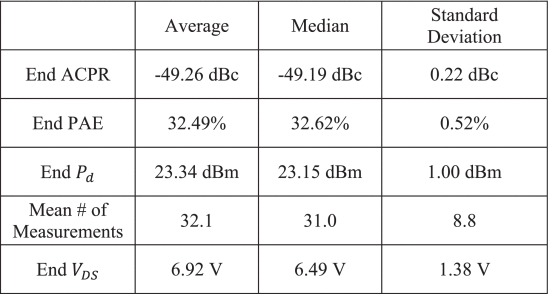
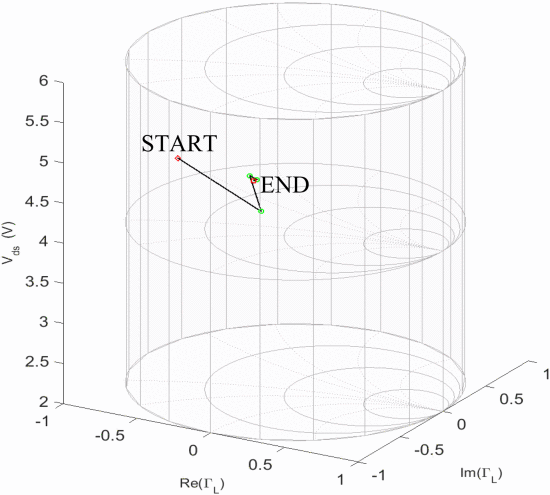
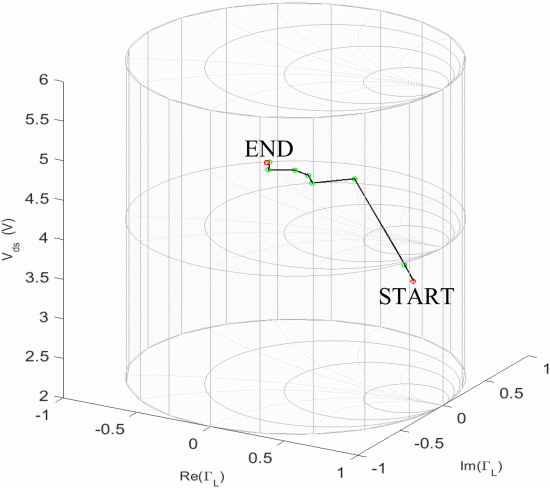
Figs. 6 and 7 show examples for the search trajectories of the fast search algorithm from two different starting locations. These results are typical examples of the path that the algorithm will take to reach the optimum. Table II shows data for a few selected algorithm runs for various starting points throughout the VDS Smith tube, and Table III shows statistics summarizing the algorithm results for 50 different simulation start locations. Table II shows some variation in the final VDS values obtained by the algorithm. While, on first thought, this may appear to be contrary to expectations, such differences in the end VDS value may be expected to occur, since the ACPR and PAE surfaces in Fig. 5 are very close together for a wide range of VDS. What is important is that these results show similarity in the constrained optimum PAE values.

Figure 6
Fig. 6.

Simulation search trajectory for starting ΓL= 0.8/0° with VDS = 2.5 V. The search converges to a constrained optimum at ΓL= 0.17/83° with VDS = 6.02 V, requiring a total of 26 measurements. The constrained optimum PAE is 33.12%, with final ACPR = −49.06 dBc.

Figure 7
Fig. 7.

Simulation search trajectory for starting ΓL= 0.8/90° with VDS= 10.5 V. The search converges to a constrained optimum at ΓL= 0.38/49° with VDS = 9.01 V, requiring a total of 31 measurements. The constrained optimum PAE is 31.92%, with final ACPR = −49.14 dBc.

TABLE II Simulation Results for Different Starting Points
Table
TABLE III Summary of Results for All Simulated Start Locations
Table

Tables II and III also show an additional significant result of the algorithm: its effect on the output power Pd delivered by the amplifier. In practice, maintaining sufficient output power is important to successfully illuminate and receive information from radar targets. Since the output power is not included as a constraint, it can potentially be affected by the optimization, as both Pd and VDS play an important role in determining the PAE, which is given by the following equation:

PAE=PdPinVDSID ×100%.(13)
View SourceRight-click on figure for MathML and additional features.

Thus, the PAE can be increased by either increasing the output power Pd or decreasing the drain–source voltage VDS. The associated gain is also shown in Table II. It can be seen that the gain and Pd are significantly lower for the starting point ΓL= 0, VDS = 2.5 V than for many of the other starting points. For this starting point, the end VDS value is also lower. The lowering of both Pd and VDS causes the PAE to be approximately the same as for the other starting points. An opposite effect is seen for the starting point ΓL= 0.8/−90°, VDS= 10.5 V, where the values of Pd and gain are approximately 1 dB higher than for the other starting points. However, the end value of VDS is over 1.5 V greater than any of the other points shown in the table. While the higher value of Pd increases the PAE, the higher value of VDS lowers it so that the PAE value is approximately the same as the other endpoints displayed in the table. As such, there is some variation in the output power values. The standard deviation of the end Pd values is shown in Table III to be 1 dBm, which is significant; however, the PAE value standard deviation is only 0.52%. Whether these variations are acceptable in practice depends on the system-level specifications regarding target illumination power and expected path loss. This is an important topic for future work.

SECTION IV.

Measurement Results

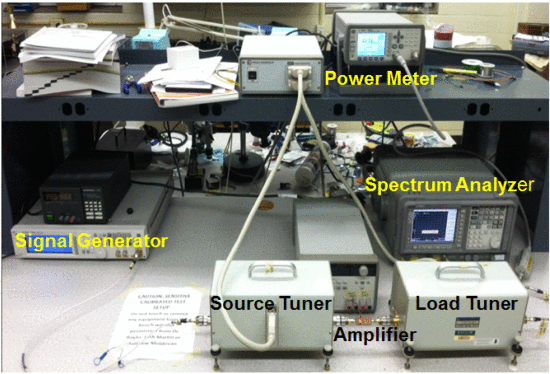
In addition to the simulated algorithm runs in ADS, the presented algorithm was tested in measurement for 20 different starting points using a Maury Microwave Automated Tuner System. Fig. 8 shows the measurement setup for bench testing. The load impedance tuner provides the desired ΓL. A power meter is used for the PAE measurements, and a spectrum analyzer is used to measure the ACPR. The desired waveform is produced by a signal generator. A Microwave Technology MWT-173 GaAs metal–semiconductor field-effect transistor was used for the measurement testing of the algorithm. This is a different device than was used for the simulations, in an effort to provide a different scenario to test algorithm operation. The waveform used for these measurement tests was a modified chirp waveform centered at 3.3 GHz. This waveform consisted of a constant tone as well as a tone that sweeps in frequency, and the bandwidth of the waveform was 16 MHz. The input power to the amplifier was held constant at 14.5 dBm, the gate voltage VGS was held constant at −1.5 V, and VDS was allowed to vary from 2 to 6 V. An ACPR limit of −28.5 dBc was used for the measurement testing.

Figure 8
Fig. 8.

Measurement test setup.

Fig. 9 shows the surface representing ACPR = −28.5 dBc and the surface representing PAE = 32.19%, which represents the largest PAE value that can be obtained within the ACPR limit. The point where the two surfaces intersect in that figure represents the constrained optimum combination of ΓL and VDS as found by a brute force examination of the entire Smith tube, which requires hundreds of measured points. Also note that, similar to the device used for simulation, the PAE and ACPR surfaces are close together for a large VDS range, which could result in a fairly large range of final VDS values for the constrained optima found by different algorithm runs.

Figure 9
Fig. 9.

Acceptable region for the ACPR limit of −28.5 dBc and region with the PAE greater than 32.49%, taken from traditional load-pull measurements at multiple values of VDS. The constrained optimum is found at ΓL= 0.22/158° and VDS= 4.5 V.

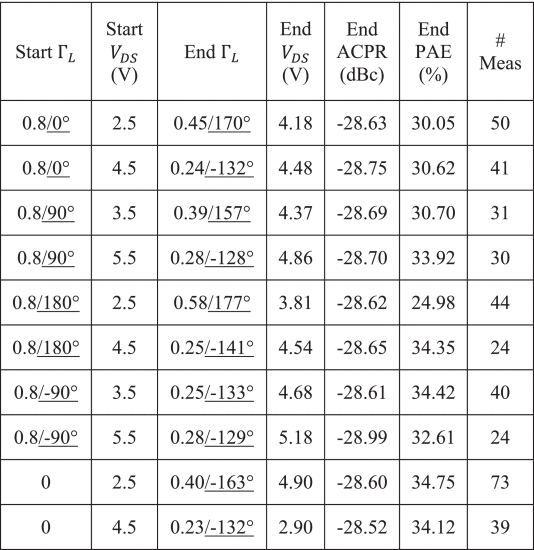
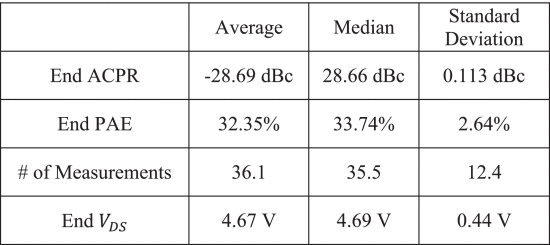
Figs. 10 and 11 show the results of running the search algorithm from two different Smith tube starting locations. Table IV shows data for a few selected algorithm runs for various starting points throughout the Smith tube, and Table V shows statistics summarizing the algorithm's results for all 20 start locations that were measured.

Figure 10
Fig. 10.

Measurement search trajectory for starting ΓL= 0.8/180° with VDS= 4.5 V. The search converges to a constrained optimum at ΓL= 0.25/−141°, VDS= 4.54 V, requiring a total of 24 measurements. The constrained optimum PAE is 34.35%, with final ACPR = −28.65 dBc.

Figure 11
Fig. 11.

Measurement search trajectory for starting ΓL= 0.8/0° with VDS= 3.5 V. The search converges to a constrained optimum at ΓL= 0.35/149°, VDS= 4.48 V, requiring a total of 32 measurements. The constrained optimum PAE is 30.62%, with final ACPR = −28.75 dBc.

TABLE IV Measurement Results for Different Starting Points
Table
TABLE V Summary of Results for All Measured Start Locations
Table

For the most part, the results in Tables IV and V show consistent PAE results with some variation in the end locations due to the large region where the PAE and ACPR contours are close together, much like in simulation. However, the start location at ΓL= 0.8/180° and VDS = 2.5 V showed a lower quality result. Further analysis of the Smith tube in this region revealed that the ACPR contours in that area are very flat and not convex, which causes the algorithm to divide its step size down and stop the search too early. This type of ACPR contour is a common occurrence for start locations, which are particularly far from the desired optimum for the search algorithm. This demonstrates the importance of either choosing start locations that are close to the desired optimum or carefully selecting the boundaries of the Smith tube such that regions that are far from the desired optimum are not considered by the search algorithm.

While the adjustment of drain bias voltage has been specifically examined in this paper, it is also possible to consider the real time, simultaneous optimization of the gate–drain voltage bias VGS. Adjusting VGS would essentially allow the operating class of the amplifier to vary between classes A, AB, B, and C. This would allow further exploitation of the tradeoff between linearity and efficiency. Class A, one extreme, would provide excellent ACPR but would lower PAE, while class C is most likely to provide very high PAE while resulting in a much higher ACPR. The real-time optimization for amplifier class could allow the amplifier to make real-time transitions between the classes based on waveform changes as well. If a larger amplitude message were to be provided, the amplifier could raise its VGS automatically by rerunning the optimization. This would preserve linearity. However, if a small amplitude signal is then provided to the amplifier, the optimization could be rerun and would likely result in a lower value of VGS, preserving efficiency. As such, real-time optimizations of either (or potentially both) bias voltages of a transistor should be very useful.

This work represents an initial algorithm for the optimization of PAE and ACPR by simultaneous optimization of load impedance and bias voltage. As discussed earlier, in a practical radar system, output power and gain will also be important criteria of the radar transmitter amplifier. It is critical for the transmitted power of the radar to be sufficient to illuminate the target such that a reflection can be detected above the noise floor at the receiver. Such considerations could be used to derive a minimum output power of the transmitter and its power amplifier. This improvement of the search would include the minimum amplifier output power as an additional constraint in the bias Smith tube search, in a similar approach to that recently demonstrated in the Smith chart [23].

SECTION V.

Conclusion

A fast search algorithm has been presented to find the combination of load reflection coefficient and drain voltage in the VDS Smith tube to maximize PAE within an ACPR constraint. This is the first demonstration of simulation- and measurement-based joint matching circuit and bias voltage optimization using the Smith tube framework. Simulation and measurement results for the algorithm have been shown to demonstrate the effectiveness of the algorithm under a variety of conditions. A potential weakness of the algorithm when using start locations far from the desired optimum has also been demonstrated, and possible methods for avoiding this weakness have been suggested. This algorithm is expected to find usefulness in future adaptive radar transmitters, which need to adjust their operating parameters to changing requirements in real time.

ACKNOWLEDGMENT

The authors wish to thank Keysight Technologies for cost-free loan of the Advanced Design System software, and Modelithics for donation of model libraries through the Modelithics University Program. The authors are grateful to D. Macias of Baylor University for data collection during the revisions of this paper.

See the top organizations patenting in technologies mentioned in this article
Advertisement