Introduction
Adaptive and reconfigurable transmitter power amplifier circuitry can optimize output power while ensuring spectral constraints are met upon frequency or beam changes in 5G communications and sensing systems. Adaptive RF systems typically include a controller, reconfigurable circuitry, and on-board measurement and waveform agility capabilities. Fast, accurate, on-board measurements are needed to evaluate system performance, enable decision making, and perform fast adaptation and reconfiguration.
Traditional RF test benches using standard bench-top measurement equipment (signal generators, power meters, spectrum analyzers, and load-pull systems, both passive and active [1] ) can provide excellent accuracy but are too slow or large to deploy in a real-time adaptive system. Many cognitive and adaptive radio and radar platforms are controlled by a software-defined radio (SDR) platform. Performing measurements directly with the SDR platform can reduce cost and size, integrating the measurements with decision making.
Existing solutions using SDRs have been created targeting the evaluation of adjacent channel power ratio (ACPR) [2] and environmental RF energy detection [3] . We demonstrate the accuracy and speed of microwave power and spectrum measurements using the SDR, useful for real-time evaluation of a transmitter-chain reconfigurable amplifier.
Fast Evaluation of Adaptive System Performance
The use of an SDR platform to perform microwave power and spectrum measurements can greatly decrease the time necessary for each evaluation [4] . However, the system implementation of [4] requires sending all of the acquired IQ data to the host computer for processing. Such an approach is limited by the communication bandwidth between the SDR and host computer, as well as the host’s processing rate. This can limit processing to a subset of all transmit/receive (TX/RX) cycles or reduce operating bandwidth. While communication and processing overhead can be eliminated or greatly reduced by performing the measurement processing on the SDR’s on-board field-programmable gate array (FPGA), the performance of sufficiently accurate measurements becomes the challenge, allowing the raw data to be used to provide useful microwave measurements for decision making. We discuss RF output power and spectral-mask compliance [5] measurements using the SDR, needed for the real-time reconfiguration approach of Dockendorf [4] .
A. Average RF Output Power
Using measurements of the in-phase and quadrature components of the SDR
voltage measurement, the average RF output power of a 50 Ω system can be
determined by the average of the root-mean square voltages of each IQ
sample as discussed in
[6]
:
![]() \begin{equation*}P_{out} = \frac{1}{N}\sum\limits_{n = 1}^N \frac{I_n^2 + Q_n^2}{2(50)} ,\tag{1}\end{equation*}
\begin{equation*}P_{out} = \frac{1}{N}\sum\limits_{n = 1}^N \frac{I_n^2 + Q_n^2}{2(50)} ,\tag{1}\end{equation*}
where P out is the average RF output power of the system in W over N samples, and I n and Q n are the instantaneous sample voltages.
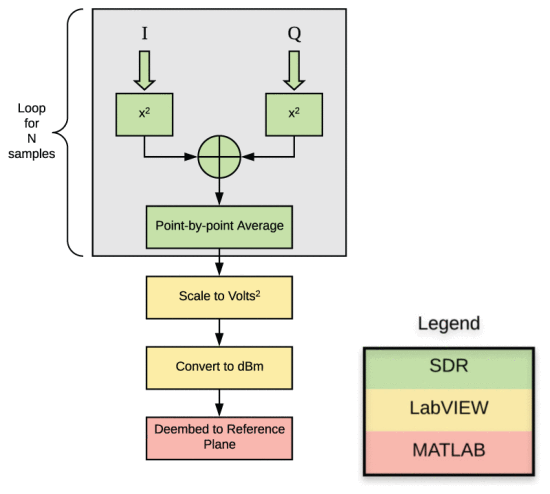
When performing this calculation using the SDR, each sample’s amplitude may only be known in raw analog-to-digital converter (ADC) units rather than volts, with the conversion factor dependent on the exact system configuration. This conversion factor can be factored out of the calculation of P out on the FPGA and applied later if desired. The same approach can also be applied to the factor of 1/100. However, it is useful to include the factor of 1/ N on the FPGA, as intelligent averaging implementations can be utilized that maintain high dynamic range with a limited bit-width while avoiding fixed-point arithmetic overflow.
The resulting calculation (in units-squared) is sufficient to optimize real-time adaptive system performance based on comparing subsequent measurements. If exact knowledge of the system’s performance is desired, this intermediate calculation can be transferred to the host computer, adjusted to volts-squared, watts, or dBm, and de-embedded as desired. This process is illustrated in Fig. 1 for an example custom load-pull system designed in MATLAB, with SDR communication performed using an intermediate LabVIEW driver, similar to [4] .
For high-accuracy power measurements, the reported values can be calibrated by measuring a reference signal at various power levels with both a traditional RF power meter and the SDR prior to system deployment, creating a correction table that can be applied to each reported SDR power measurement.
B. Spectral Mask Compliance
Spectral-mask compliance can be determined by comparing a normalized received signal’s spectrum to a predefined mask using the
S
m
metric of
[5]
:
![]() \begin{equation*}S_m = \mathop {max}\limits_{f_m} (S(f_m) - M(f_m)),\tag{2}\end{equation*}
\begin{equation*}S_m = \mathop {max}\limits_{f_m} (S(f_m) - M(f_m)),\tag{2}\end{equation*}
where S ( f ) is the normalized amplitude of the signal spectrum, and M ( f ) is the predefined spectral mask, all measured in dB, and f m consists of all frequencies outside the main transmit band. As performed in regulatory measurements, the maximum in-band power is fixed at 0 dBc, and the mask is applied relative to the maximum in-band power.
Flowchart for calculation of average RF output power over N samples for a custom load-pull system.
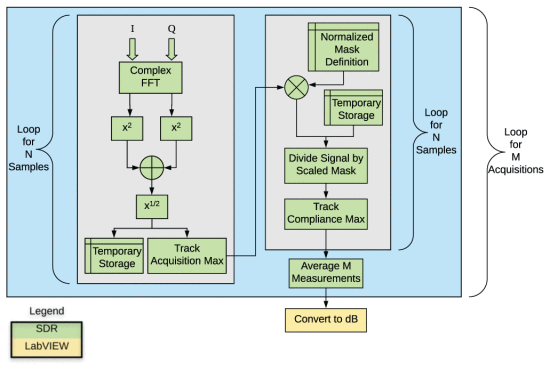
Because of the computational complexity of logarithms and exponentials on an FPGA, it is more efficient to use linear units rather than dB. As with power measurements, it is also beneficial to use raw ADC values during the calculations. Additionally, rather than normalizing the waveform by its maximum value, it is best to scale the mask to match the maximum value of the waveform because of the lower latency of multiplication compared to division on FPGAs.
Multiple S m measurements are often needed to achieve consistent measurements due to measurement noise, even with standard bench-top equipment [5] . Rather than the averaging multiple spectrum measurements for each S m calculation, storage resources can be minimized by calculating S m for each spectrum measurement and averaging S m values. Accuracy of each spectrum measurement can be ensured through IQ imbalance corrections [7] . This approach is shown in Fig. 2 .
Flowchart for calculation of spectral mask compliance over N samples and M acquisitions for a custom load-pull system.
Pulsed Waveform Tx/Rx Synchronization
To apply the power and spectrum measurement techniques of Section II to a real-time adaptive pulsed RF system (such as a radar transmitter), the measurement period must consistently align with the transmission period, accounting for latency between transmission and signal observation due to signal processing and propagation (TX/RX latency). This latency may vary according to changes in the signal path due to varying test environments (cables, adapters, etc.) or system parameters that affect the rate of signal processing (sample rate, on-board FPGA clock speed, etc.).
Continuously monitoring the received signal and triggering measurements when a specified power threshold is exceeded is not sufficient, as variations in output waveform amplitude levels resulting from reconfiguring the load impedance can result in inconsistent latency measurements. Instead, the system’s TX/RX latency can be evaluated on the first transmission cycle and applied as a delay to each transmission cycle. The latency should be determined using an initial system configuration with a known receive power threshold.
Measurement Results
To evaluate the accuracy and speed of the presented RF performance evaluation system in comparison with the state-of-the-art, SDR measurements of a Skyworks 65017-70LF InGaP packaged amplifier were compared to standard amplifier load-pull measurements using Maury Microwave’s Automated Tuner System software with standard RF bench-top equipment (Keysight Technologies signal generator and power meter/sensor) and a Maury Microwave passive automated load-pull tuner. For the SDR measurements, full load-pull measurements were performed using a custom MATLAB load-pull routine, an Ettus X310 SDR with UBX-160 RF daughtercards, and the 90 W evanescent-mode cavity-based impedance tuner described by Semnani [8] . All load-pull measurements were performed with a 60 MHz chirp waveform centered at 3.3GHz with an input power of 3 dBm and an amplifier bias voltage of 7 V.
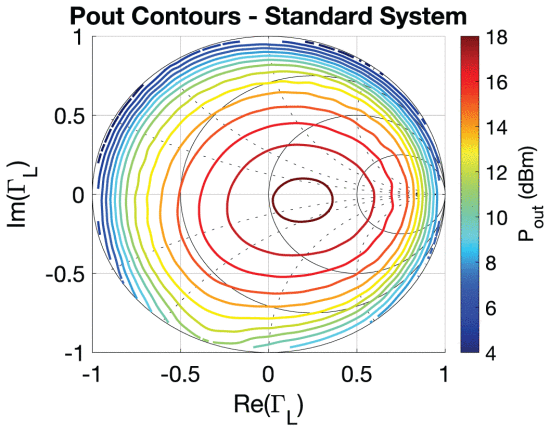
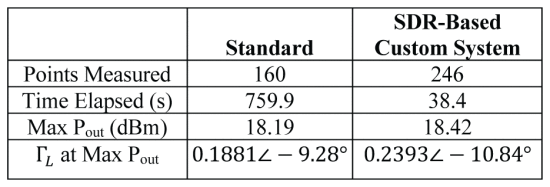
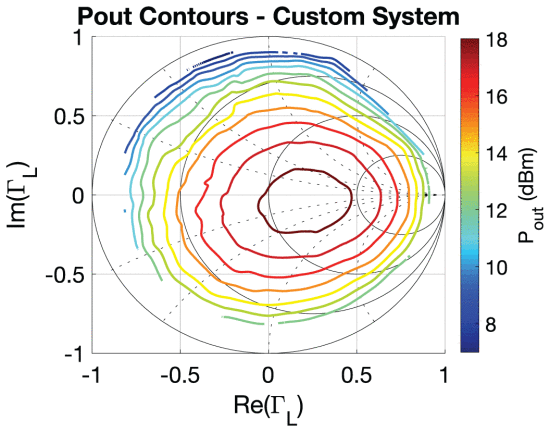
Load-pull measurements of the amplifier’s output power utilizing the Maury and SDR systems are shown in Figs. 3 and 4 , respectively. Table 1 compares the number of evaluated impedances and the time required for each system to complete the load-pull, as well as the maximum performance and corresponding load impedance. Comparison of the resulting contours and optimum load impedances reveals good agreement between the two systems. Furthermore, the SDR system is able to evaluate each point in roughly 3% of the time needed for the traditional system, owing to significantly faster tuning times (~30 ms vs 3–5 s) and reduced equipment communication overhead. The significant reduction in measurement time allows for more realistic integration of power and spectrum measurements into real-time software-defined, reconfigurable microwave transmitter systems, such as the cognitive radar system of [9] .
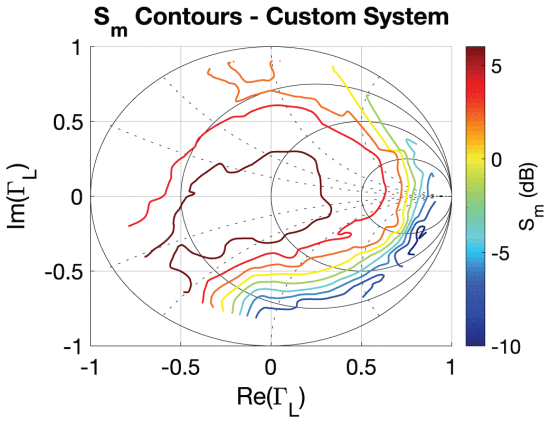
Although the Maury load-pull system does not directly support spectral mask compliance measurements, a load-pull of S m using the cavity tuner with the SDR platform is included in Fig. 5 to demonstrate the SDR platform’s capabilities. The time required for this load-pull was 38.3 seconds for 246 evaluated points, or 156 ms per point.
Load-pull of RF output power using a standard RF load-pull system (redrawn in MATLAB). Contours for 4–18 dBm shown with 1dB spacing. Max. value of 18.19 dBm at Γ L = 0.19∠ − 9.3°.
Conclusions
The use of a software-defined radio for performing of power and spectrum measurements has been demonstrated, achieving accuracy and speed suitable for on-board performance evaluation of real-time reconfigurable systems. The SDR-based measurement approach has maintained accuracy similar to that of a traditional load-pull system while vastly improving the speed of the system, evaluating each impedance in 3% of the time. Additionally, this specific implementation has improved upon the computational requirements and addressable instantaneous system bandwidth of previous implementations. In future work, we expect to demonstrate even faster measurements, moving all evaluation to the SDR without assistance from the host computer.
Load-pull of RF output power using an SDR-based RF load-pull system. Contours for 7–18 dBm are shown with 1 dB spacing. Max value of 18.42 dBm at Γ L = 0.24∠ − 10.8°.
Load-pull of spectral mask compliance using an SDR-based RF load-pull system. Contours for S m = −10 dB to +6 dB are shown with 2 dB spacing.
ACKNOWLEDGMENT
This work has been funded by the Army Research Laboratory (Grant No. W911NF-16-2-0054). The views and opinions expressed do not necessarily represent the opinions of the U.S. Government. The authors are grateful to John Clark of the Army Research Laboratory for assistance in development of this publication.


