The
increased use of the radar spectrum for sharing with wireless
communications is resulting in new, innovative techniques for
reconfigurable radar transmission from a cognitive radar platform. A
cognitive radar can sense, adapt, and respond to its environment [1]–[2][3].
Frequency agility has been demonstrated to maximize power-added
efficiency (PAE) and spectral compliance using software-defined radio
(SDR) control [4] with a 90-W evanescent-mode (EVA) cavity tuning technology demonstrated by Semnani [5]. This technology must be merged with real-time spectrum sharing and radar signal processing, as described by Kirk [6],
and implemented in a system known as “SDRadar”. However, a major
challenge of this merger is that the EVA cavity tuner can require over
100 ms to perform some tuning operations, whereas the coherent
processing interval (CPI) of a radar is often on the order of a few
milliseconds. As such, it is not possible to adjust the circuit
configuration for every individual CPI. Instead, the average performance
over multiple CPIs can be optimized. This paper describes how impedance
tuning can successfully be merged with the metacognitive decision
process of a spectrum sharing cognitive radar.
SECTION II.
Tuning Options
Upon
deciding the transmit parameters (center frequency, bandwidth,
waveform—collectively referred to as the SDRadar's “action” or “state”)
in real time, the system will reconfigure a matching network to optimize
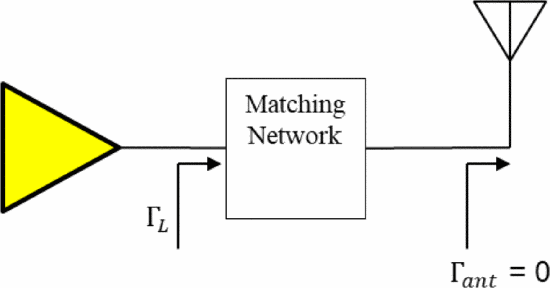
the impedance shown to the power amplifier device. This concept is
shown in Fig. 1. The impedance (and therefore the load reflection coefficient ΓL)
will be optimized to deliver maximum power to the load device from the
matching network. For these experiments we demonstrate matching assuming
that a matched impedance is presented to the matching network by the
next stage, possibly the antenna (i.e. Γant=0).
Dockendorf demonstrates a modified gradient search for a
single operating frequency and bandwidth, where the search is performed
in the two-variable space of n1 and n2, which are the position numbers of the resonator discs in the EVA cavity tuner [4]. More specifically, the method in [4]
is useful for occasional (every 10–20 seconds) changes in operating
frequency, the cognitive spectrum-sharing radio proposed by Kirk [6]
is expected to change operating frequency and bandwidth as frequently
as every CPI, which is expected to be potentially less than 10 ms. As
the method of [4]
requires a consistent system configuration throughout the optimization
process in order to evaluate the effects of varying load impedance,
whereas the tuning technology is unable to adjust on the time scale
required, i.e., it is incompatible with the needs of a rapidly adapting
system such as the SDRadar. To compensate for this, the gradient search
method can be adjusted to utilize information from multiple observed
transmit states during a single iteration; with the goal of maintaining
the performance of the overall system across multiple states.
Rather than the modified gradient search of Dockendorf [4],
which is a constrained maximization of PAE under spectral mask
constraints, we modify the search into a simple gradient search to
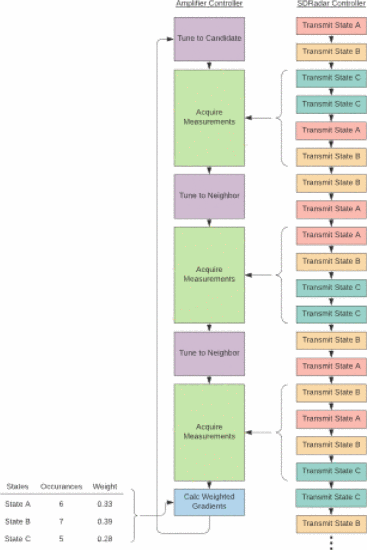
maximize the output power Pout at the output of the tuner. Fig. 2
shows a possible scenario where the transmit states are quickly
changing relative to the tuning times. In this simplified scenario,
three transmit states occur in random order, and it is desired that the
selected tuner configuration minimizes the weighted distance to the
optimum tuner configuration for each observed state. The left column
represents the steps within a single iteration of the amplifier
controller's algorithm, while the right column represents the sequence
of states selected by the SDRadar controller. For gradient evaluation,
the EVA tuner begins at the candidate point and then must tune to the
two neighboring points in the (n1,n2)
plane required to assess how the power delivered to the load varies
with load impedance for each transmit state. At the end of the
measurement window, consisting of N
measurements, an estimate of the gradient of the delivered power is
calculated for each transmit state. Each of these gradients are weighted
according to the number of times each transmit state occurs at the
candidate point and two neighboring points. In the bottom left of Fig. 2,
the number of occurrences is shown for each transmit state, and the
weight that each state's results is given in the final gradient
calculation is shown.
Note that a state must be observed at each
step of the current gradient iteration (the candidate and both of its
two neighboring points) to be considered as a valid state; otherwise, a
gradient estimate cannot be computed for that state. In situations where
a state is only observed at some (but not all) of these steps, its
performance during the current iteration is ignored, and the weights are
computed as if the state were never transmitted.
The overall search vector is calculated as a weighted average of the gradients:
v¯=Σnwnv¯n,(1)
View Source \begin{equation*}
\bar{v}=\Sigma_{n}w_{n}\bar{v}_{n}, \tag{1}
\end{equation*} where wn is the weight calculated for state n based on the relative number of occurrences of that state in a given time frame and v¯n is a Pout gradient estimate for state n with respect to ΓL. For a total of N′ measurements corresponding to valid states, where state n was encountered cn times, the weights accompanying each vector v¯n are given by
 wn=cnN′.(2)
View Source \begin{equation*}
w_{n}=\frac{c_{n}}{N^{\prime}}. \tag{2}
\end{equation*}
The resulting step vector is then used in place of the gradient estimate of [9] to select the next candidate location in the (n1,n2) plane.
In a sense-and-respond situation where spectral prediction is
not used, the approach of using past states during a given time period
should be used to determine the weights (as illustrated in Fig. 2).
In a predict-and-respond situation where spectral prediction is used, a
schedule of future states to be transmitted should be available. The
weights shown in the lower left of Fig. 2
could then be calculated based on the relative occurrences of each
state in the future schedule. We will herein use past states to give the
weighted average best tuner (n1,n2) setting.
SECTION III.
Experimental Results
The proposed algorithm was tested with a Microwave Technologies MWT-173 field-effect transistor (FET) with VDS=4.5V,VGS=−1.4V, and Pin=14 dBm.
This transistor is driven by a dynamic transmission system that chooses
between three different transmit states with equal probability. These
states correspond to RF center frequencies of 3.1, 3.3, and 3.5 GHz. A
new state is selected (with replacement) for each measurement performed
during a run of the search algorithm. For the results of this section, a
measurement window N=20
was used, meaning that at each tuner position visited by the search, 20
measurements were taken of randomly varying states prescribed by the
system.
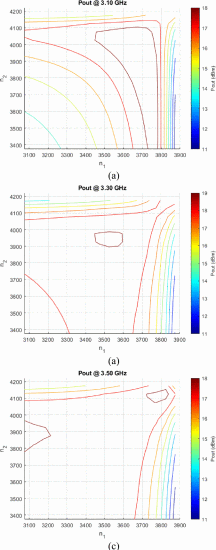
To allow comparison of algorithm results with traditionally measured data, Fig. 3
shows the output power contours for each individual state that was
used. While these states have similar performance for high values of n1 and n2, they have different performance levels and contour slopes for most of the search space. For example, Pout drops significantly when moving to the bottom left of the (n1,n2) plane at 3.1 GHz, while remaining reasonably high for 3.3 and 3.5 GHz in the same region.
Three trials were performed for this search using random
selection of measured states during the search from the three possible
states. For the sake of simplicity, each state was given an equal weight
in terms of state occurrence probability (despite the randomly varying
occurrence of each state during the search.)
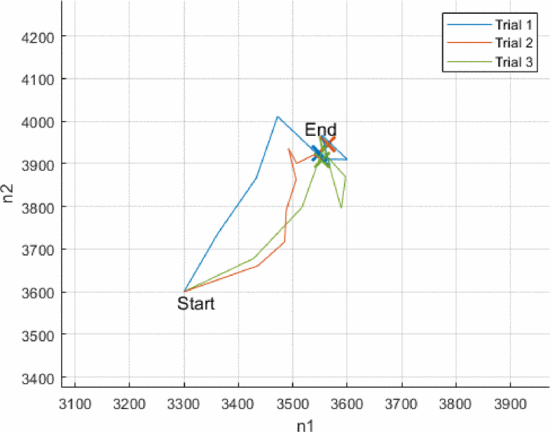
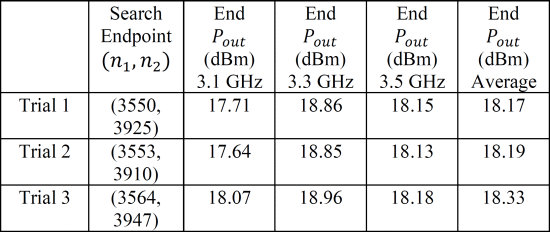
Fig. 4 shows the search path taken by three separate runs of the search starting from (n1,n2)=(3300,3600).
The variations derive from both measurement noise, changes in the
actual relative occurrences, and orders of occurrence of the three
operating-frequency states. Despite taking different paths (directed by
the varying distributions of observed states), all searches converge in
the same region, as expected because each underlying probability
distribution for the randomly generated states is the same.
Table I compares Pout at the endpoint for each individual frequency and the weighted average for each trial in Fig. 4.
This data shows that even though the endpoint is not optimum for each
frequency, the overall average performance is still good. The final
column for average Pout does not necessarily equal the average of the Pout
for the three frequencies since it is the weighted average of the
measured powers based on the random distribution seen at the endpoint.
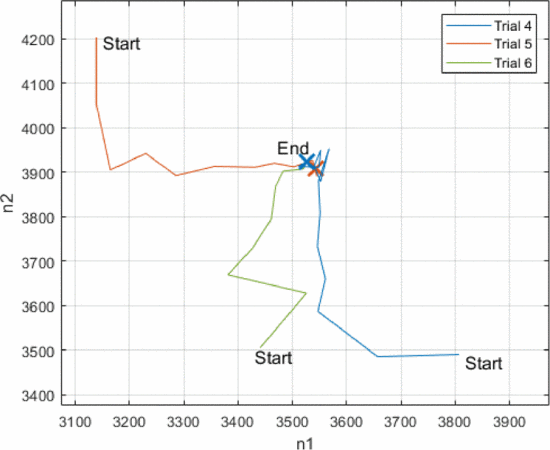
Fig. 5 shows the search paths taken by three separate runs, labeled as Trial 4, Trial 5, and Trial 6, that start at three different (n1,n2)
locations. Trial 6 ends very close to the end of Trail 4 and thus the
‘X’ indicating it is obscured. The fact that all of these searches that
start from different points in the search space still converge near the
endpoints of Trials 1, 2, and 3 shown in Fig. 4 demonstrates robustness of the search.
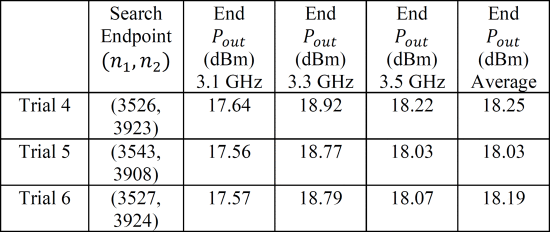
Table II shows the Pout
values at three frequencies at the endpoint for the searches with
varied starting points (Trials 4, 5, and 6). This data reinforces the
fact that while the search endpoint may not be optimal for each point,
the average performance is good and demonstrates a good compromise in
the tuning to provide good performance at all of the operating frequency
states.
Fig. 6
shows the search path of Trial 5 with the gradient vectors shown for
all three frequencies (3.1, 3.3, and 3.5 GHz) at each candidate (n1,n2)
point. This provides a visual demonstration of how the gradient search
vectors combine to create the search path. The gradients for each
individual state are calculated independently and then normalized to
have the same length. These steepest-ascent direction vectors of equal
length are then multiplied by the weights of the corresponding state,
and the vectors are combined to give the direction in which the search
will proceed to the next candidate. This vector is then scaled to have
magnitude equal to the current step size parameter setting in the
gradient search. Near the start point, the gradients for the three
states are oriented similarly. However, as the search gets to its third
candidate, the 3.5 GHz gradient is oriented nearly opposite to the 3.1
GHz gradient, and significantly different from the 3.3 GHz gradient. As
the endpoint is approached, the gradients remain oppositely directed,
illustrating the tension between the different state gradients as the
average position begins to converge. A weighted average of the emphasis
on performance for the three states is expected based on the relative
occurrences of the states during the gradient evaluations. This weighted
performance is shown to be successful based on the results shown in Table II.
An
algorithm designed to optimize transmitter power amplifier impedance
tuning for average output power in a frequency-agile software-defined
radar system has been demonstrated. The search is a demonstration of a
fast, real-time impedance tuning procedure that can allow average output
power and range performance to be optimized in a situation where the
tuning operation is much slower than the change in operating frequency.
Using an EVA cavity tuner with a tuning search time of 2–10 seconds,
this approach can be utilized in systems with a much faster CPI. Next
steps include the implementation of this search in a real-time
software-defined radar platform in a continuous operating environment.
In such a situation, it will be useful to assess the need for the
performance of impedance tuning based on detection of the average states
changing significantly. This investigation is planned as part of the
ongoing collaborative Army Research Laboratory SDRadar effort.
ACKNOWLEDGMENT
The authors are grateful to John Clark of the Army Research Laboratory for his helpful insights in preparing this paper.
![]()
![]()


