Introduction
As the radio-frequency (RF) spectrum becomes increasingly congested, the applicability of real-time reconfigurable radar systems is more pronounced. Many frequency bands previously allocated solely to radar have been either reallocated for spectrum sharing or deallocated completely.
In spectrum sharing scenarios, a cognitive radar must adapt its transmission characteristics, such as center frequency and bandwidth, in real time to avoid RF interference (RFI) from other spectrum users. An example of such a system is the Software Defined Radar (SDRadar) [1], which also utilizes a tunable output matching network to optimize the transmit power amplifier load impedance for output power for the active transmit bandwidth.
Given the wide range of possible transmissions, it is infeasible for a cognitive radar to predetermine all optimal configurations in advance. Instead, a real-time circuit optimization algorithm must be used, such as the average gradient algorithm of [2]. Such search algorithms converge to a single optimum for a given situation. However, since the RFI environment and corresponding optimum will continue to change long after search convergence, continual optimization is required.
Approaches for restarting gradient searches have been demonstrated in cases where the search space is multimodal [3], where search momentum may be misguiding the search [4], and where periodic restarts help overcome ripples in the objective function [5]. Restarting optimization can also be used to continue searching for a potentially moving optimum value, which is the focus of this work.
However, unnecessary search restarts during live system optimization will degrade performance as the configuration is varied from the current optimum during the optimization routine. As such, it is desirable to perform optimization only when a better optimum setting is available. We present a method for relating changes in utilized transmit frequencies to potential output power improvement to reduce the number of search restarts required for continual circuit optimization of cognitive radar systems.
Methods
To determine when a previous optimum configuration is no longer optimal in the current environment, some portion of the cognitive radar configuration or performance must be monitored for variation over time. While the radar transmitter output power could be monitored for changes in performance, the radar may transition to a state where the output power remains the same, but additional power could be obtained by reoptimizing for the new configuration. As such, the sole monitoring of output power to detect need for a re-optimization can be misleading. Instead, this work monitors the frequencies utilized by the cognitive radar, as this directly represents the configuration, and changes in this frequency configuration can indicate a need for re-optimization.
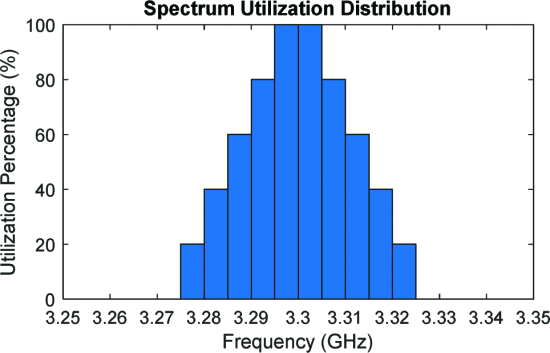
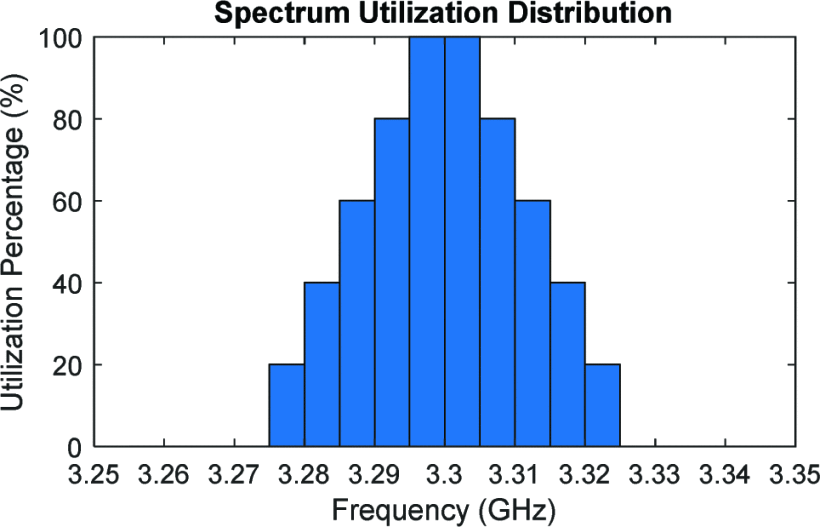
For monitoring, the utilized transmit frequencies are represented as a one-dimensional histogram, where bin height represents how often each frequency was utilized by recently transmitted waveforms. For consistency across varied history windows, this histogram is normalized by dividing each histogram bin by the number of radar transmissions represented by the histogram. This approach provides flexibility in instances where the cognitive radar is varying its rate of adaptation in response to the dynamics of the spectral environment. An example of this histogram for a series of radar transmissions is shown in Fig. 1. As different spectral environments permit broader or narrower spectrum usage, the overall mass of this distribution may change. To account for this effect when comparing different distributions, this histogram is translated into a probability mass function (PMF) by dividing the magnitude of each bin by the L1 norm of the distribution.
Example histogram of transmit spectrum utilization for a series of radar transmssions. This distribution can be obtained by sequentially transmitting five different radar waveforms, each centered at 3.3 GHz with varying bandwidths (50 MHz, 40 MHz, 30 MHz, 20 MHz, and 10 MHz). As the frequency range 3.295-3.305 GHz is used in each transmission, these frequencies have a utilization percentage of 100 %. Likewise, 3.275-3.28 GHz and 3.32-3.325 GHz are only utilized as part of the 50 MHz transmission, resulting in a utilization percentage of 20 %.
Metrics for comparing such functions are common, including the Kullback-Leibler (KL) divergence [6], root-mean-square deviation (RMSD) [7], and earth mover’s distance (EMD) [8]. The selected metric can be correlated with potential power improvement, and a threshold can be used to specify when the radar should be reoptimized.
KL divergence, as defined by (1), is widely used in information theory to measure the relative entropy between two distributions [6]. However, this is not a true metric; that is, DKL(P||Q) is not necessarily equal to DKL(Q||P).
Additionally, it can be non-finite when the two distributions contain
different zero-valued entries, such as when the distributions do not
overlap, as is often the case for distributions of utilized SDRadar
transmit frequencies.
![]() \begin{equation*}{D_{KL}}(P\left\|
Q \right.) = \sum _{n = 1}^N{P_n} * \log
\left({\frac{{{P_n}}}{{{Q_n}}}}\right)\tag{1}\end{equation*}
\begin{equation*}{D_{KL}}(P\left\|
Q \right.) = \sum _{n = 1}^N{P_n} * \log
\left({\frac{{{P_n}}}{{{Q_n}}}}\right)\tag{1}\end{equation*}
The RMSD metric, as defined by (2), is also not ideal for this application, as it uses nonlinear weighting based on the magnitude of the difference [7].
Additionally, the RMSD is not able to provide information about the
magnitude of separation between non-overlapping distributions. That is,
for a fixed number of frequency bins, N, the RMSD is saturated as
soon as the utilized bandwidths no longer share any common spectrum,
without regard for the amount of separation between the utilized
bandwidths.
![]() \begin{equation*}RMSD(P\left\|
Q \right.) = \sqrt {\frac{{\sum _{n = 1}^N{{\left({{P_n} -
{Q_n}}\right)}^2}}}{N}} \tag{2}\end{equation*}
\begin{equation*}RMSD(P\left\|
Q \right.) = \sqrt {\frac{{\sum _{n = 1}^N{{\left({{P_n} -
{Q_n}}\right)}^2}}}{N}} \tag{2}\end{equation*}
The EMD is a useful metric for comparing utilized frequency distributions. Originally proposed in [8]
as a metric for determining the similarity of images, EMD is analogous
to the minimum amount of physical work required to transform one
distribution into the other, and it provides a true metric when applied
to normalized distributions. Given one-dimensional histograms with
uniform bin width, the EMD can be computed as the sum of the absolute
value of the cumulative sum of the differences between the
distributions. For ease of thresholding in this application, knowledge
of the possible transmit frequency range is used to normalize the EMD
with respect to the max possible EMD, resulting in the final
computation:
![]() \begin{equation*}EMD(P,Q) = \frac{1}{{N - 1}}\sum _{n = 1}^N\left| {\sum _{i = 1}^n{P_i} - {Q_i}} \right|,\tag{3}\end{equation*}
\begin{equation*}EMD(P,Q) = \frac{1}{{N - 1}}\sum _{n = 1}^N\left| {\sum _{i = 1}^n{P_i} - {Q_i}} \right|,\tag{3}\end{equation*}
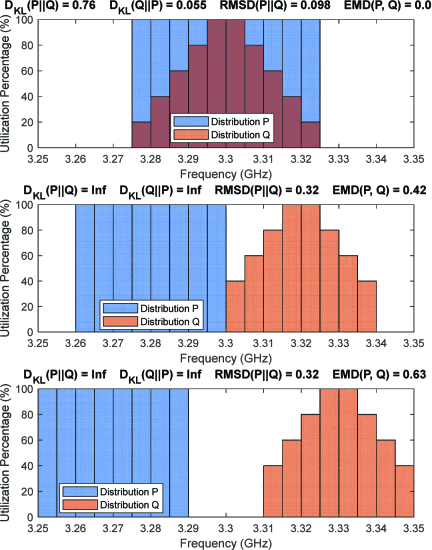
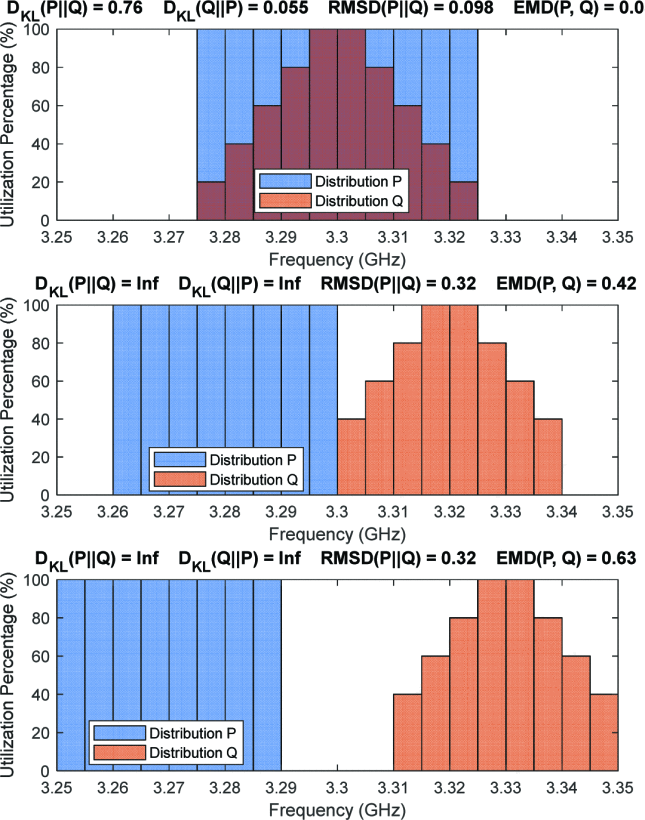
To illustrate the ability of each of these methods to describe differences in spectrum utilization by a cognitive radar, three different transmit spectrum utilization comparison scenarios are presented in Fig. 2, along with the resulting metric values.
Measurement Results
The methods of this paper were tested using the SDRadar system of [1] operating at 3.3 GHz with a bandwidth of 100 MHz. A Microwave Technologies MWT-173 field-effect transistor (FET) was used as the amplifier device, with VDS = 4.5 V, VGS = –1.4 V, and Pin = 14 dBm. The load impedance presented to the transistor is adjusted using the evanescent-mode cavity tuner of Semnani [9]. A simulated RFI environment is created using an Agilent N5182A vector signal generator playing back looped RFI signals of 50000 samples at a sample rate of 60 MSa/s.
A. Threshold Determination
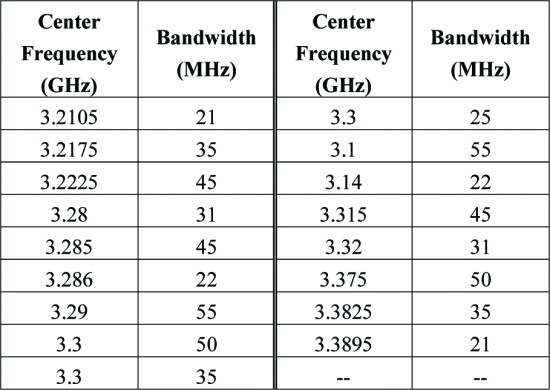
For the purposes of this work, it is desired that an optimization will always be performed when more than 0.5 dB of additional output power is available. Changes in RFI that result in the current tuner impedance performing no more than 0.5 dB worse than the new (unknown) optimum may or may not be subject to optimization. To determine the EMD threshold that produces this behavior, a selection of 17 SDRadar waveforms distributions were optimized, with each chosen to provide a representative sample of the possible SDRadar transmit waveforms. These waveforms are listed in Table I.
Distance metric results for three different spectrum utilization cases: fully overlaped, no overlap, and large separation. Each metric’s result is shown at the top of the corresponding distribution diagram. As expected, we find that KL divergence becomes undefined once the distributions begin to separate. Additionally, RMSD fails to report the degree of separation between the two, becoming saturated once the distributions are disjoint. However, EMD is able to reflect the absolute separation between the distributions, which allows it to be correlated to the expected change in radar performance over various frequency bands.
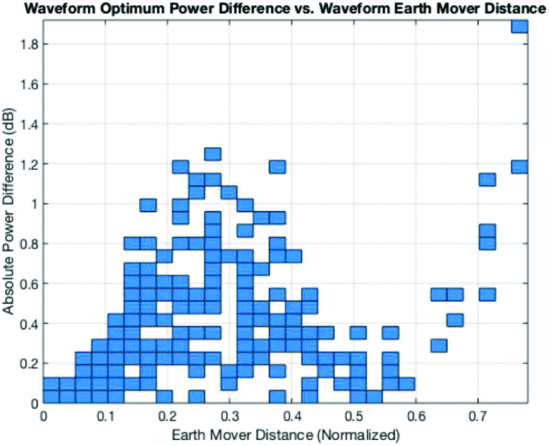
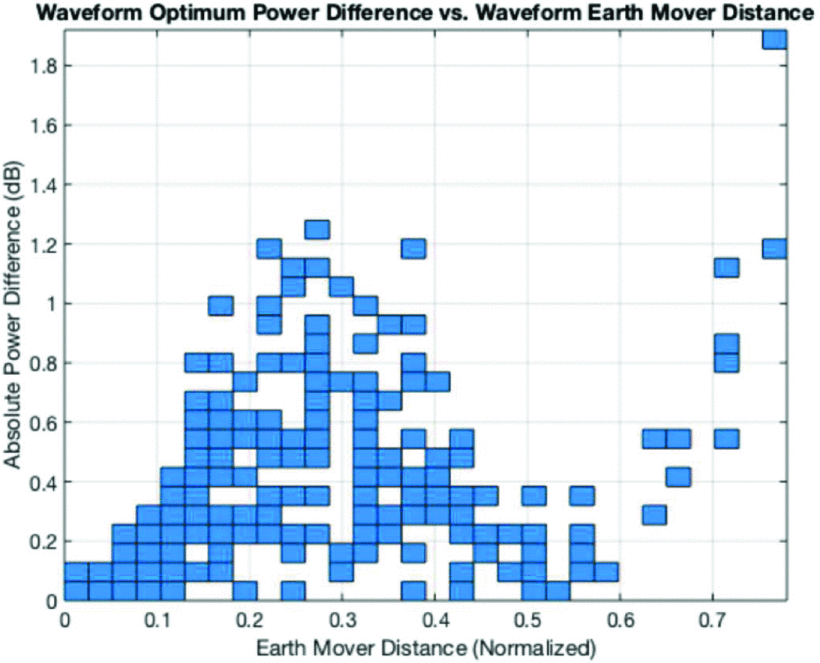
The optimum power and corresponding impedance for each waveform was then determined, and the performance of each waveform’s optimal impedance was evaluated for all other waveforms. In additional, the EMD between each pairing of waveforms was calculated. The footprint of a histogram relating EMD to differences in the performance of optimal impedances is shown in Fig. 3.
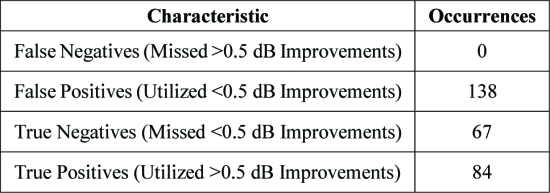
Based on the results of Fig. 3, an EMD threshold of 0.1 ensures that opportunities to obtain more than 0.5 dB of performance improvement are never ignored (false negative rate of 0). Detailed detection characteristics for this threshold are listed in Table II. In general, the relationship between EMD and potential power improvement will vary for different systems, as each system’s susceptibility to performance variations with frequency will differ.
Relationship between the EMD of two waveforms and the output power improvement obtained by reoptimizing after a transition between two waveforms.
B. Threshold Performance
To evaluate the selected threshold’s performance in practice, a simulated RFI environment was presented to the SDRadar, with the circuit optimization algorithm running in tandem. During each iteration of the experiment, the current RFI environment may be randomly changed, which the SDRadar will adapt to by changing its transmit waveform accordingly. The probability of an RFI change occurring begins at 10 % for the first iteration, increases by 10 percentage points for each iteration with no change, and resets to 10 % after each RFI change. This unpredictable RFI pattern ensures the reoptimization criteria is not dependent on how long ago the last optimization was performed.
Following each potential RFI transition opportunity, the current SDRadar transmit distribution is compared to the previously optimized distribution using the EMD metric defined in (3), without knowledge of whether an RFI transition occurred. If the EMD surpasses the chosen threshold of 0.1, a circuit optimization is triggered; otherwise, the circuit configuration remains unchanged.
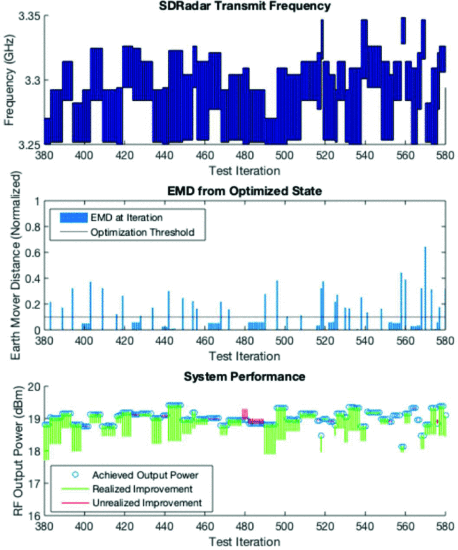
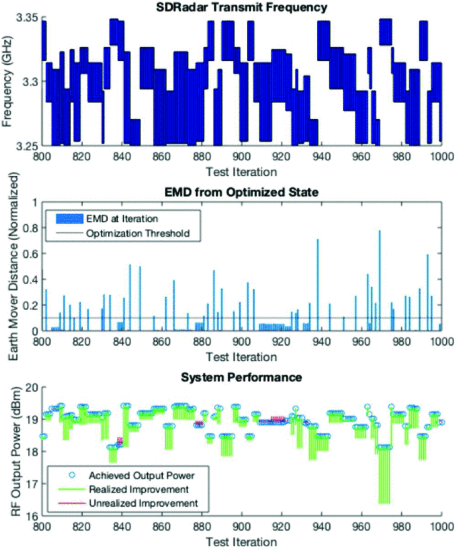
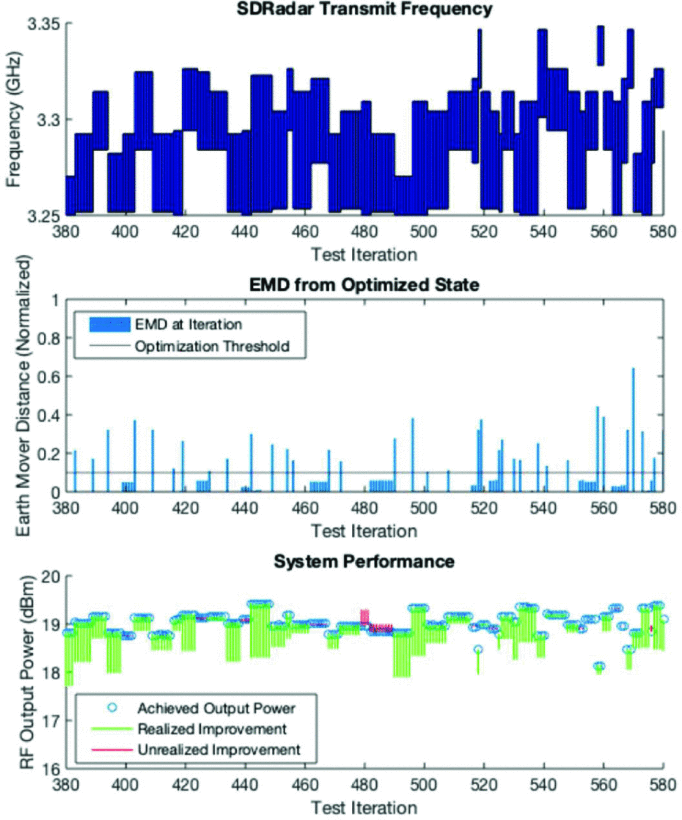
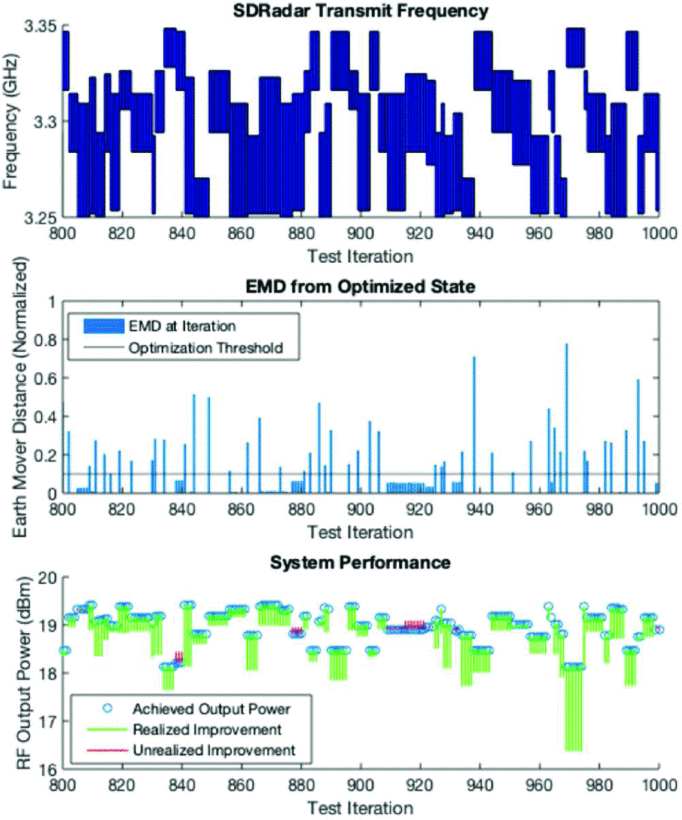
After 1000 total iterations, the power that could have been achieved during each iteration was determined. Fig. 4 shows the transmission frequency range versus time, the EMD for each transition, and the RF output power performance near the largest missed improvement. Fig. 5 shows the same features over a different time period that includes the largest utilized improvement found in the experiment.
Over the 1000 iterations, the RFI was changed 269 times, with the threshold reoptimizing the circuit 219 times and maintaining the existing configuration 50 times. Based on these results, the metric and threshold performed as designed, with a maximum unrealized performance improvement of 0.33 dB (compared to the desired maximum unrealized performance improvement of 0.5 dB) and an average realized performance improvement of 0.48 dB. As the desired maximum unrealized performance improvement was not exceeded, we conclude that reoptimization is triggered in time to minimize the potential performance loss associated with the periods when the radar is not actively being optimized.
Realized and unrealized performance improvement (bottom) and measured EMD (middle) of SDRadar frequency transitions (top) for a 200 iteration window centeed at the largest unrealized performance opportunity of 0.33 dB (Iteration 480).
As expected, the threshold initiated optimizations more than necessary, with 133 of the optimizations resulting in less than 0.5 dB of performance improvement. If the EMD threshold was instead chosen to permit some degree of false negatives, then the number of optimizations providing less than the target performance improvement would be reduced.
Conclusions
A method for monitoring changes in cognitive radar behavior has been demonstrated for use in determining when a radar’s configuration has shifted significantly enough to warrant reoptimization. This method has been shown to successfully ensure that reoptimization occurs when more than 0.5dB of additional output power can be obtained, while reducing the number of unnecessary reoptimizations, improving the consistency of the system’s performance. This work may be useful in further development of an approach that dynamically selects the reoptimization threshold based on the performance improvements achieved by previous optimizations.
Realized and unrealized performance improvement (bottom) and measured EMD (middle) of SDRadar frequency transitions (top) for a 200 iteration window including the largest realized performance opportunity of 1.76 dB (Iteration 969).


