Introduction
Radar transmitters are becoming, by necessity, frequency-agile. In the United States, for example, 100 MHz of mid-band spectrum from 3450 to 3550 MHz, previously allocated to radar, has been reallocated for sharing with fifth generation wireless communications as the primary user through America's Mid-Band Initiative [1]. The increasingly congested spectrum-sharing environment in which modern radar systems are forced to operate requires radars that can change operating frequencies quickly and with high performance over significant bandwidth. This environment can be intelligently navigated by cognitive radars.
A cognitive radar, by definition, must contain intelligent signal processing, information feedback, and the capability to adapt its waveform [2]–[4]. One such radar is presented by Kirk in [5]–[7] and discussed in Section II. In cognitive radars, the perception–action cycle (PAC) is often used to form the decision processes. The radar senses the spectrum and the frequencies of interferer operation (perception) then modifies its transmission to provide coexistence with other radio-frequency devices (action) [3], [5]–[10]. Additionally, spectral prediction may be used to determine interferer frequency usage prior to the decision-making and tuning [11].
In the radar's transmitter power amplifier (PA), the output power is dependent on the load impedance provided to the active device [12] as well as radar's transmit configuration (transmit frequency, bandwidth, and waveform) [13]. To maximize the radar range, impedance tuning can be performed on the transmitter PA in real time. Tuning of a narrow-band matching network provides the potential for higher gain compared to a fixed, broadband matching network due to the theoretical gain-bandwidth tradeoff described by the Bode–Fano Criterion [14]–[16]. The benefits of impedance tuning, therefore, are most widely seen in systems where tuning over a wide range of frequencies is required. While benefits are visible (as shown in this article) over a sub-band such as the S-band radar allocation, the advantages of tunable radar amplifiers will be even more remarkably impactful in future systems, which will be designed under the emerging paradigm of spectrum sharing and adaptivity. Using the first- and second-generation high-power evanescent-mode cavity tuners of Semnani [17], [18], we have demonstrated a fast gradient-based search algorithm for maximizing the power-added efficiency while meeting spectral compliance, and we have shown that a software-defined radio (SDR) can be used to control impedance tuning in similar applications [19]–[21]. However, even with streamlining the SDR process, the fastest tuning times for the cavity tuner are between 30 and 50 ms for one tuning operation, while a full optimization can require as long as 10 s to complete. Even the 30–50 ms required for one impedance tuning iteration is much longer than the pulse repetition interval (PRI) of most radars, which is often less than 1 ms. As such, a cognitive radar is likely to alter its transmit configuration multiple times within the time required to perform even a single impedance tuning operation. To allow the radar to adapt freely from pulse to pulse, an approach must be devised that will allow tuning while the underlying system is modifying its configuration independently of the tuning process. Such an approach can be run in parallel with the radar's PAC.
To independently optimize a time-varying system (such as a cognitive radar), several additional complications must be addressed. Because the optimal circuit configuration will necessarily change over time, continual monitoring and reoptimization are required. While gradient algorithms have been adapted to perform continuous tracking of time-varying optima [22], [23], they require that the system remains time-invariant during individual gradient evaluations, which would limit the adaptation rate of the cognitive radar. To overcome this limitation, multiple transmit configurations must be considered simultaneously and optimized in aggregate. We have demonstrated a method that evaluates the gradient of several configurations simultaneously [24], but this method does not directly optimize average system performance. Alternatively, the scalarization technique of Miettinen [25] provides a useful framework that can be adapted to evaluate the average performance of the time-varying system, which we use in this article. However, the length of time required to accurately evaluate system performance must be addressed in both of these approaches, as recognized by McBride [26]. This problem is discussed in more detail in Section III.
The literature contains several applications of optimization techniques to various radar problems. Among the optimization problems considered are the Pareto optimization of radar-embedded communication waveforms [27], and joint design of transmission signal and receive filter in reverberating environments [28] and for multiple-input multiple-output radar systems [29].
We present a real-time, continuous, gradient-based circuit optimization algorithm designed to optimize a cognitive radar's average transmitter output power and corresponding maximum detectable range over a dynamic measurement period, while the radar independently varies its transmit frequency, bandwidth, and waveform, which also impacts the average output power. Specifically, our key novel contributions include the following conditions:
A gradient estimation method for an averaged set of time-varying performance contours.
Demonstration of real-time circuit optimization of a cognitive radar's transmit amplifier during spectral adaptation built on this gradient estimation method.
Mid-optimization methods for adapting the gradient estimation measurement window size and current search step size to changing spectral environments.
Finally this article is organized as follows. Section II describes the software-defined radar (SDRadar) platform used for our experiments. Section III discusses how gradient optimization methods can be applied to cognitive radar transmitters. Our algorithm is presented in Section IV, and measurement results using the cognitive radar of Section II are presented in Section V. Finally, Section VI concludes this article.
Software-Defined Radar (SDRadar)
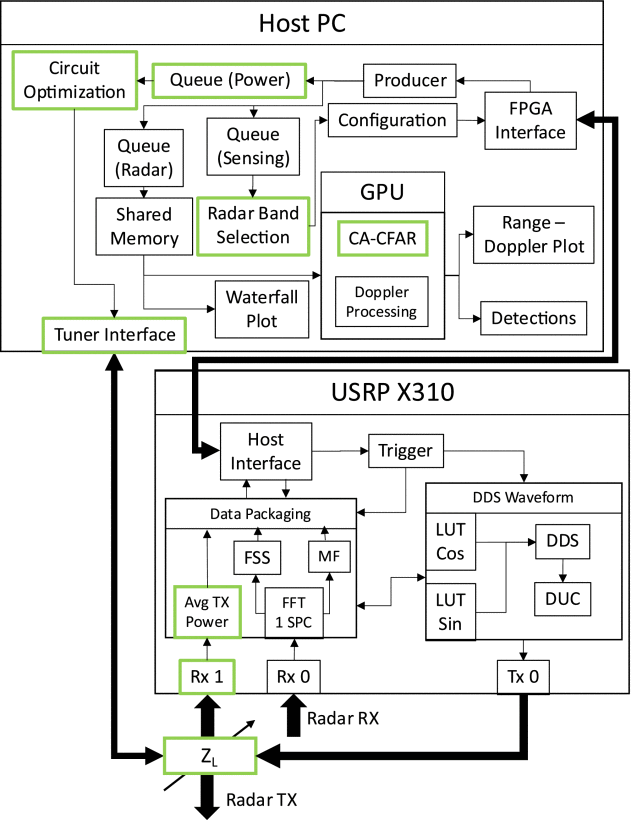
While the techniques presented in this article can be adapted to many cognitive radar systems, we demonstrate our capabilities using an extended version of the SDRadar platform of Kirk [5]–[7]. In summary, the SDRadar platform is built using an Ettus X310 SDR with two UBX-160 RF daughterboards in conjunction with a host computer system. The SDRadar monitors its 100 MHz operating band and selects the largest unoccupied portion of the spectrum to use for radar operations. The system adapts within this band for each transmitted pulse. A block diagram of this system outlining the separation between SDR and host computer is shown in Fig. 1; our modifications are outlined in green and discussed throughout this section.
While the original SDRadar system was designed to operate for a definite period of time with all collected data being stored for additional evaluation and processing offline, we have adjusted the system to operate indefinitely by streamlining the data processing, migrating much of the cell-averaging constant false-alarm rate processing to the graphics processing unit, and discarding older collected data over time.
Additionally, we have added band-hopping capability to the SDRadar for use in instances where the current 100 MHz band does not provide sufficient open spectrum for operation. If SDRadar detects that the largest unoccupied portion of its current band is narrower than a specified threshold, it will randomly switch to one of the other permitted 100 MHz bands, sampled without replacement until the list is exhausted.
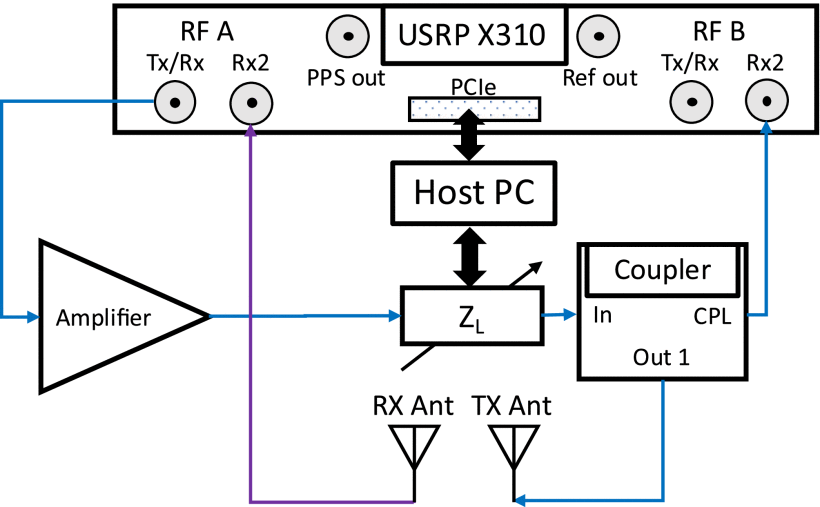
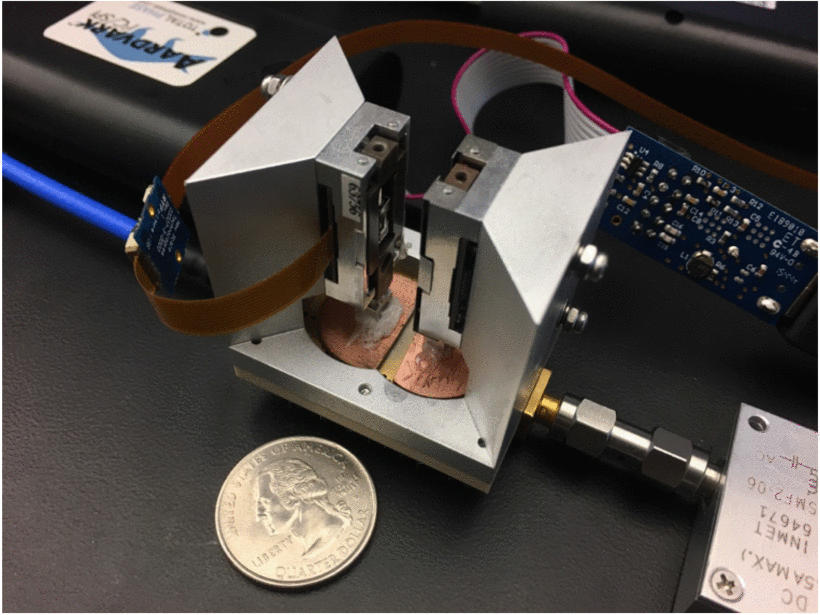
For transmitter PA testing, we have included an external transistor with an adjustable load impedance tuner (labeled as
Hardware block diagram for a deployed SDRadar system with SDR, host computer, adaptive transmit amplifier, and transmit and receive antennas. SDRadar transmit signal travels along the blue path, while target responses and interference are received through the purple path. Figure adapted from [6] with permission. The coupler connected to RF B Rx2 should be selected such that the loopback power does not exceed the maximum SDR input power of −15 dBm.
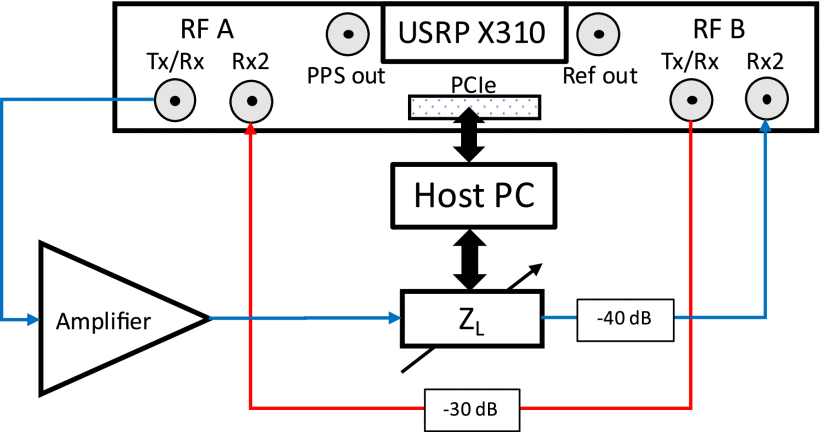
Unless otherwise noted, all tests in this article were performed in measurement using the configuration of Fig. 3 with a Microwave Technologies MWT-173 field-effect transistor as the amplifier with
Hardware block diagram for SDRadar system testbed with SDR, host computer, and adaptive transmit amplifier. This hardware configuration is used for all tests discussed in this article. Synthesized RFI travels along the red path (RF B Tx/Rx to RF A Rx2), while SDRadar transmit signals travel along the blue path (RF A Tx/Rx to RF B Rx2). Figure adapted from [6] with permission.
Adapting Gradient Methods to Cognitive Radar
Existing approaches for real-time circuit optimization using gradient-based algorithms can optimize an uncharacterized system within a few seconds [19], [21]. However, one common assumption shared by these approaches is that any system parameters outside the control of the optimization algorithm are held static for the duration of the optimization. While some consideration has been given to later system changes after optimization [20], the behavior of a truly adaptive transmitter, which can adjust its transmit configuration on the order of microseconds in response to changes in the spectral environment, has not been addressed. These rapid changes lead to two primary difficulties that must be overcome to apply gradient-based algorithms to truly adaptive systems: acquiring meaningful estimates of the system performance metric gradient and handling instances where the optimal circuit configuration varies over time.
A. Acquiring Meaningful Gradient Estimates
The success of a gradient search strongly depends on the quality of its gradient estimations. Reliable estimates of the gradient for a given system performance metric can be obtained by evaluating the metric (dependent variable) at various values of load reflection coefficient or load impedance (independent variable). For valid gradient estimations, all system parameters (aside from impedance) must be held constant during the set of measurements used to compute the gradient; otherwise, the gradient will not reflect the impact of impedance on performance. This requirement conflicts with the adaptive nature of a cognitive radar since the radar may vary other parameters, such as the transmit frequency, bandwidth, and signal content during a single gradient estimate, all of which impact the evaluated performance metric and corrupt the observed relationship between metric and impedance. Note that this effect may not necessarily manifest as a change in the optimal impedance. Even in cases where the performance of various signals with respect to impedance differs only by some constant offset (sharing the same optimal impedance), this constant performance offset can be enough to skew the gradient in the direction that was evaluated while the better performing configuration was active.
The simplest approach to integrate spectral adaptation and circuit optimization is to throttle the rate of spectral adaptation such that the transmit configuration is held constant throughout each gradient evaluation, ensuring performance differences can be attributed solely to changes in impedance. However, such an approach would result in an unacceptable decline in the radar's ability to quickly respond to changes in the available spectrum, as multiple identical pulses would necessarily be transmitted, even if the chosen pulse is no longer ideal for the current spectral environment.
Alternatively, given a PRI that is substantially longer than the waveform length and a sufficiently fast impedance tuner, it is possible to optimize the transmit circuit for each pulse in loopback. By using a switch, the transmit antenna would be disconnected during the interval in which the receiver is gathering and assessing the radar returns, allowing a full optimization utilizing multiple performance evaluations of the next pulse to be performed prior to transmission. Unfortunately, impedance tuning technology capable of handling the high-power required of a radar transmitter that is also able to adjust multiple times over the course of a single PRI is not yet available. Additionally, optimizing in loopback during the “off” times of the radar negatively affects the power efficiency of the system, as the power used during optimization must be dissipated through nontransmissive means.
Given the state-of-the-art high-power impedance tuner used for the experiments in this article, a single impedance tuning operation requires approximately 30 ms. Given the PRI of 409.6 μs, assuming the radar can change transmit frequency on a pulse-to-pulse basis, over 70 changes in transmit frequency configuration can occur during a single impedance tuning operation, with many more changes in a full optimization, which requires multiple tuning operations.
Instead, each gradient estimation must be performed while accounting for the impacts of other changes to the system, isolating the relationship between impedance and performance. By evaluating the performance metric multiple times at each sampled impedance and tracking when each transmit configuration was used for transmission, the search can account for the performance impacts of each configuration and estimate the relationship between impedance and performance for the current set of transmit configurations (we refer to the number of performance evaluations per impedance as the measurement window).
An existing approach using this philosophy computes independent gradients for each available transmit configuration and combines the direction of these gradients in a weighted fashion based on the relative occurrences of the configurations, with configurations that are used more frequently having more influence on the result [24]. Unfortunately, this method ignores the relative magnitude and slope of each configuration's performance contours, producing an optimization result that minimizes the weighted distance from the optimum impedances of the various transmit configurations, rather than maximizing the overall average performance. Given this difference, it is recommended to optimize the average performance directly. We present our method for directly optimizing average performance in Section IV-A.
In order to evaluate average performance, it is necessary to establish what period of time should be considered during each iteration. This requires careful consideration of how the chosen measurement window for averaging will impact the performance of the search algorithm, especially as the cognitive radar's adaptation (and thus optimal averaging window) varies for different environments. If the measurement window is too small, it will not be possible to establish a consistent performance weighting across each impedance. If the measurement window is too large, the search will be slower and less responsive to changes in the cognitive radar's behavior. We discuss these impacts and an approach for selecting the optimal measurement window mid-optimization in Section IV-B.
B. Time-Varying Optimal Circuit Configuration
While very rapid, frequently recurring transmit adaptations are handled by the proposed averaging approach, more infrequent variations that result in significant shifts in the optimal circuit configuration can impact the search algorithm over longer time periods. Gradient searches typically operate to convergence; that is, the algorithm has some step size that is decremented over time until the search attempts to decrease step size below the specified lower limit. When the step size reaches this limit, a final optimum value is selected, as implemented in our existing circuit optimization algorithms [13], [19]–[21], [24], [31]. These algorithms lack a method for performing additional optimization in response to changes to the optimal circuit configuration.
Alternate approaches for gradient-based optimization addressing time-varying performance contours exist under the umbrella of online optimization, such as the works of Mokhtari [22] and Dixon [23]. In these approaches, the gradient algorithm attempts to track a time-varying optimal solution with the least amount of error possible. Like other gradient algorithms, these assume each individual gradient evaluation is performed on a fixed set of performance contours and, if adapted to use our averaging technique, could be applied to a cognitive radar.
However, these methods have some disadvantages for our specific application. Generally, these methods are most effective if changes in the optimal solution are relatively continuous or smooth. For a cognitive radar, we expect the optimal solution following a change in operating band will often be uncorrelated to the previous optimal solution, as these changes will be driven by the external spectral environment. Additionally, in situations where the optimal configuration temporarily becomes static, such as in the absence of interfering devices, gradient calculations would continue to be performed unnecessarily. In our physical system, this requires adjusting the system away from the optimal impedance, resulting in an undesirable loss of performance during the gradient measurement period.
Instead, when possible, we prefer to converge to a fixed solution and wait for any changes to the cognitive radar's behavior that would suggest a need to resume the optimization process. We have previously demonstrated the Earth Mover Distance (EMD) as a metric to quantify the radar's behavior over time, and we have correlated this metric to potential performance improvements that can be used to establish a threshold to trigger additional optimization [24].
However, this previous work [24] does not address the difficulties that arise if the optimal configuration changes while its convergent gradient-based algorithm is active. Consider a scenario where the algorithm has nearly converged to a solution, but the optimal solution suddenly moves to the other side of the search space. In this situation, the algorithm's current small step size will cause the algorithm to progress very slowly to the new solution, resulting in poor responsiveness to the change in radar transmission.
To mitigate the impact of this situation, we allow the algorithm to reconsider its decision to decrease its step size, and instead increase the step size if it determines it is no longer near the current optimal solution. We discuss our specific approach to implementing this capability in Section IV-C.
Algorithm Details
We consider the overall cognitive radar circuit optimization algorithm as four individual algorithms. These algorithms include the primary average performance gradient search and supplementary algorithms that control the active measurement window, search step size and convergence, and search activation in response to changes in the cognitive radar's behavior.
A. Average Performance Gradient Search
A
gradient search is performed to maximize the output power of the
amplifier. It has been shown that the gradient algorithm tends to
perform well for real-time circuit optimizations compared with some
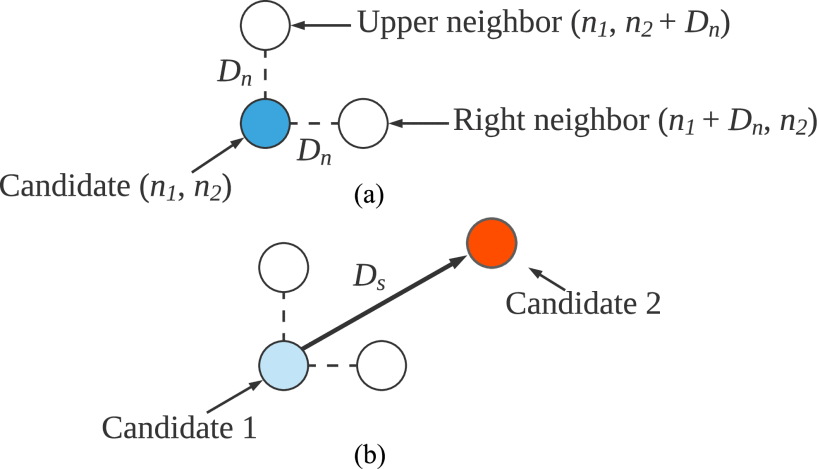
other typical algorithms [32]. The search adjusts the positions, labeled
The gradient search is similar to the search approach presented by Baylis [31], with two differences: 1) the search is applied in the
First, the tuner is set to its initial candidate
Using the power values measured at the candidate and the two neighbors, the average power of the ![]() \begin{equation*}
{\bar{P}\ \left(i \right) = \mathop \sum \limits_{k = 1}^K
{w_k}\frac{1}{{{M_{k,i}}}}\mathop \sum \limits_{m = 1}^{{M_{k,i}}}
P\left({k,m,i} \right)\ } \tag{1}
\end{equation*}
\begin{equation*}
{\bar{P}\ \left(i \right) = \mathop \sum \limits_{k = 1}^K
{w_k}\frac{1}{{{M_{k,i}}}}\mathop \sum \limits_{m = 1}^{{M_{k,i}}}
P\left({k,m,i} \right)\ } \tag{1}
\end{equation*}![]() \begin{equation*}
{\ {w_k} = \frac{{\mathop \sum \nolimits_{i = 1}^3 {M_{k,i}}}}{{\mathop
\sum \nolimits_{\kappa = 1,i = 1}^{K,3} {M_{\kappa,i}}}}.} \tag{2}
\end{equation*}
\begin{equation*}
{\ {w_k} = \frac{{\mathop \sum \nolimits_{i = 1}^3 {M_{k,i}}}}{{\mathop
\sum \nolimits_{\kappa = 1,i = 1}^{K,3} {M_{\kappa,i}}}}.} \tag{2}
\end{equation*}
This process ensures
that the average power evaluation for each point can be compared
coherently across the three gradient estimation points, as the weighting
assigned to each configuration is the same for all three points. This
approach is required, as the simpler method of naively averaging the
performance obtained at each impedance incorrectly assumes that each
configuration is used the same number of times at each impedance.
Failure to account for this variance results in a gradient that does not
accurately reflect the impact of impedance tuning alone. For instance,
if the highest performing configuration were encountered unusually often
at the upper neighboring point, the resulting gradient would be skewed
upward. Additionally, it is clear from (1) that any configurations that
are not observed at each impedance must be discarded, as the value of ![]() \begin{equation*}
{\nabla \bar{P} \approx {{\hat{n}}_1}\frac{{\bar{P}\left(2 \right) -
\bar{P}\left(1 \right)}}{{{D_n}}} + {{\hat{n}}_2}\frac{{\bar{P}\left(3
\right) - \bar{P}\left(1 \right)}}{{{D_n}}}.} \tag{3}
\end{equation*}
\begin{equation*}
{\nabla \bar{P} \approx {{\hat{n}}_1}\frac{{\bar{P}\left(2 \right) -
\bar{P}\left(1 \right)}}{{{D_n}}} + {{\hat{n}}_2}\frac{{\bar{P}\left(3
\right) - \bar{P}\left(1 \right)}}{{{D_n}}}.} \tag{3}
\end{equation*}
The unit vector in the direction of the average power gradient, ![]() \begin{equation*}
{\ \widehat {\bar{P}} = \frac{{\nabla \bar{P}}}{{\nabla {{\bar{P}}_2}}}.\ } \tag{4}
\end{equation*}
\begin{equation*}
{\ \widehat {\bar{P}} = \frac{{\nabla \bar{P}}}{{\nabla {{\bar{P}}_2}}}.\ } \tag{4}
\end{equation*}
Following the estimation of this gradient, the search proceeds one step distance
The gradient search parameter values used in this article in terms of distance in the
B. Dynamic Measurement Window
1) Impact of Measurement Window on Search Performance
As mentioned in Section III-A, the average performance gradient search relies on a measurement window parameter
To investigate the effects of
We
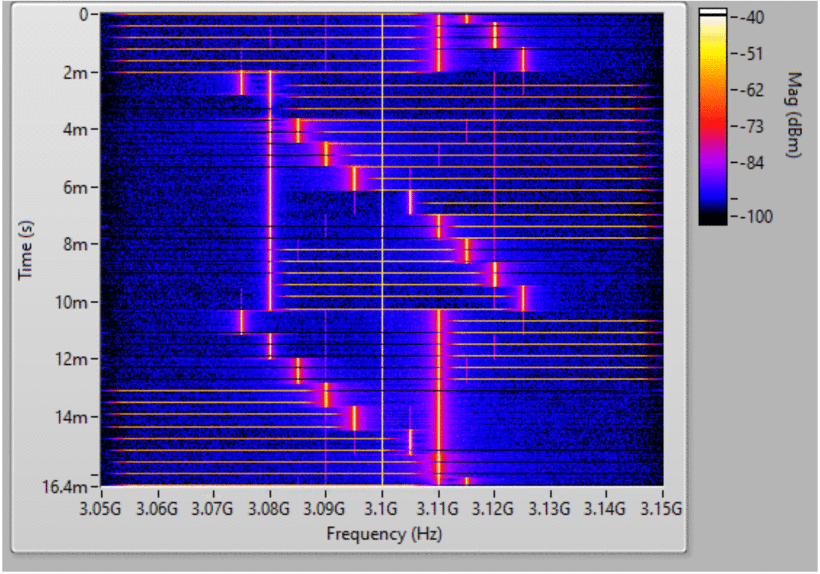
first consider the SDRadar operating in the presence of a tone sweeping
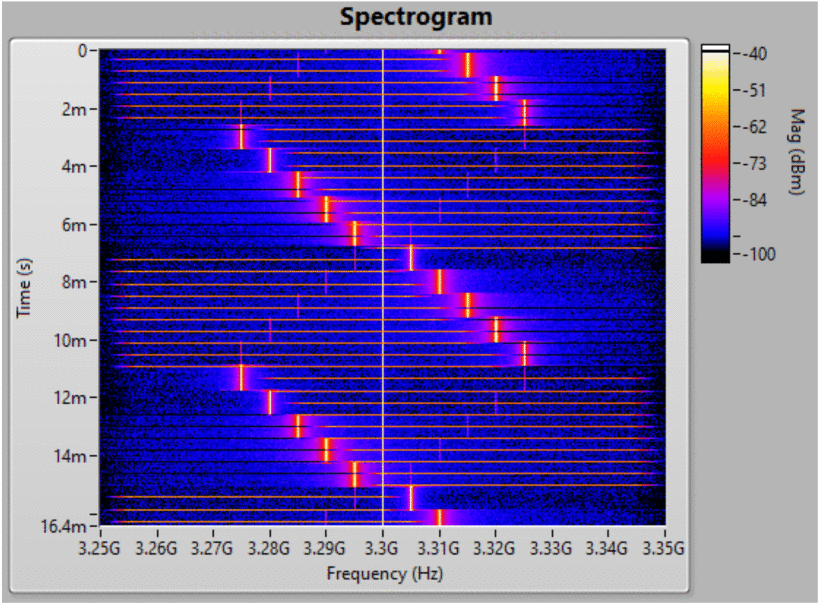
through a 60 MHz range centered at 3.3 GHz. A spectrogram of this RFI
pattern and resulting SDRadar transmit waveforms are shown in Fig. 6. A load-pull of the average performance using a large measurement window (
Waterfall plot displaying the encountered RFI (swept tone) and selected SDRadar transmit waveforms (horizontal chirp pulses) over time (vertical axis) and frequency (horizontal axis).
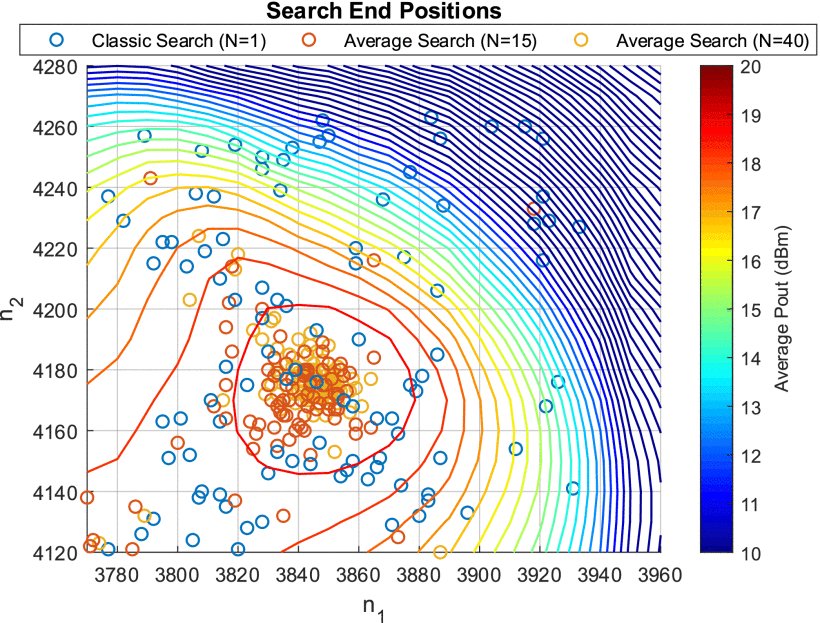
Final
positions selected by the search algorithm with different measurement
windows, shown with average power contours based on the transmit
configurations used in Fig. 6 and
Results
for this scenario using measurement windows of 15 and 40, as well as a
traditional gradient search that does not account for the varying
SDRadar center frequency and bandwidth (Classic Search (
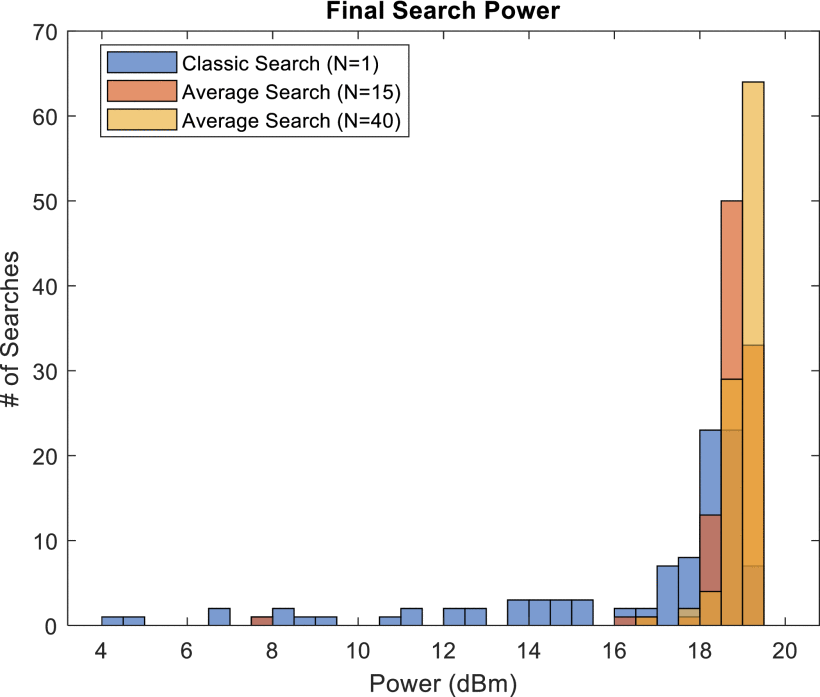
Final achieved average RF output power for the classic gradient search, average performance search with
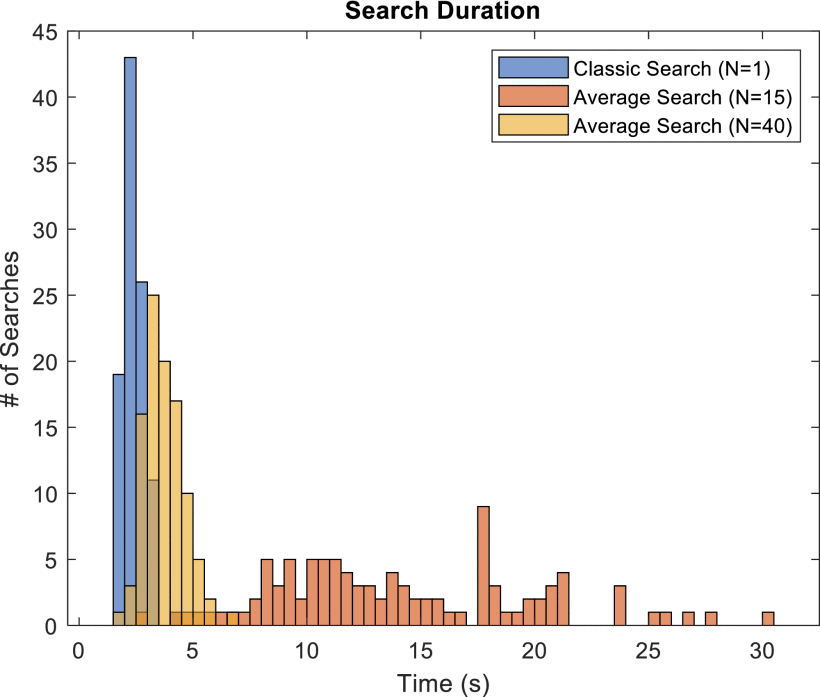
Search duration for the classic gradient search, average performance search with
This variation in convergence consistency is also evident in Fig. 7, which shows the final impedance obtained by each search. Clearly, consistency of the final location is improved by our averaging technique, with the classic search's final impedances widely distributed throughout the search space. The inability of the classic search to navigate toward the optimum is attributed to the gradient estimation errors introduced by the radar's varying transmit configuration, as previously discussed.
Fig. 9 compares the search durations of the classic search and the
Meanwhile, the average search with
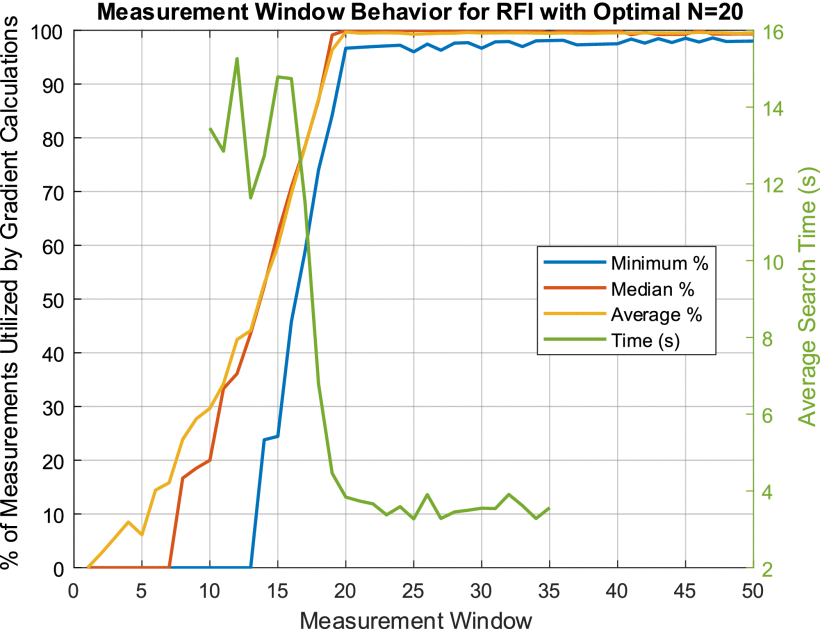
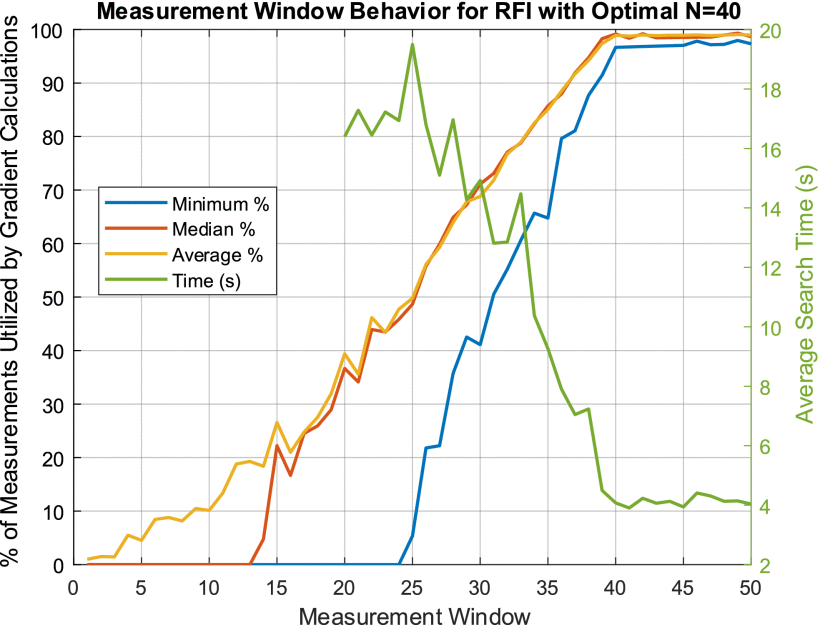
These observations suggest the existence of a measurement window “sweet spot,” below which the search time increases dramatically while the convergence consistency declines, and above which the search time increases gradually with diminishing returns on convergence consistency. Once the measurement window is large enough to consistently encapsulate the typical cognitive radar behavior over subsequent measurement intervals, there is little to gain from increasing the measurement window.
This sweet spot can be located by correlating
the search time with the number of discarded measurements (i.e.,
measurements associated with configurations that satisfy ![]() \begin{equation*}
{U\ = \frac{1}{{3N}}\ \mathop \sum \limits_{\kappa \ = \ 1,i\ = \ 1}^{K,3} {M_{\kappa,i}}} \tag{5}
\end{equation*}
\begin{equation*}
{U\ = \frac{1}{{3N}}\ \mathop \sum \limits_{\kappa \ = \ 1,i\ = \ 1}^{K,3} {M_{\kappa,i}}} \tag{5}
\end{equation*}
Correlation of measurement utilization ratio with search convergence time for the RFI scenario of Fig. 6. The optimal measurement window for this RFI scenario is around 20, as the minimum utilization ratio begins to saturate around 95%.
Furthermore, we find that the optimal measurement window varies with RFI. To demonstrate, consider the RFI scenario of Fig. 11. In this situation, we find that the optimal measurement window providing a minimum utilization ratio of ∼95% is near
Waterfall plot displaying a second RFI scenario and selected SDRadar transmit waveforms over time (vertical axis) and frequency (horizontal axis). This RFI scenario is the scenario of Fig. 6 with an additional tone hopping between two channels.
2) Iterative Optimization of Dynamic Measurement Window
Given
the variation in measurement utilization ratio for a fixed measurement
window and RFI scenario, we propose a dynamic measurement window
algorithm that seeks to maintain a utilization ratio,
The
dynamic measurement window selection utilizes several parameters: the
initial window size, the maximum iterative window increase, the target
utilization ratio range, and thresholds placed on the number of allowed
consecutive iterations that the utilization ratio is allowed to be
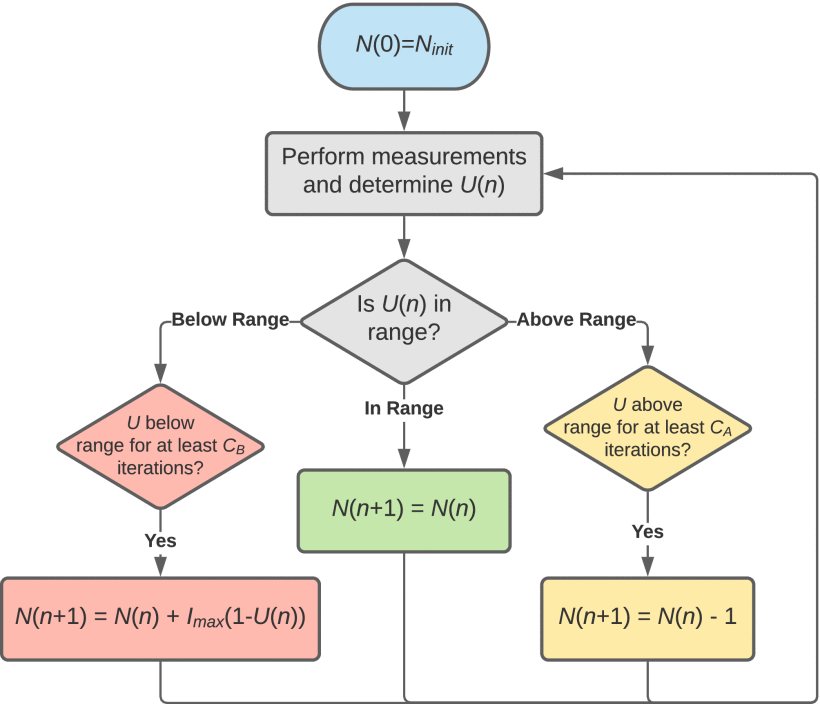
outside of the target range before adjustments are made. If ![]() \begin{equation*}
{N\ \left({n + 1} \right) = \ N\left(n \right) + {I_{{\rm{max}}}}\left({1 - U\left(n \right)} \right)} \tag{6}
\end{equation*}
\begin{equation*}
{N\ \left({n + 1} \right) = \ N\left(n \right) + {I_{{\rm{max}}}}\left({1 - U\left(n \right)} \right)} \tag{6}
\end{equation*}
It is required that the utilization ratio fall outside of the range for multiple consecutive iterations to filter out unnecessary adjustments that would be triggered by anomalies in the utilization ratio, such as those caused by the sudden introduction of a new interferer mid-window, whose effects on the cognitive radar's behavior would still be well described by the current window size had the interferer been present for the entire window.
A flowchart of the dynamic measurement window algorithm is included in Fig. 13, and Table II describes the algorithm parameters.
C. Step Size Convergence
In typical gradient algorithms, as described in [13], [19]–[21], [24], [31] and Section III-A, instances where a performance reduction is observed after stepping to the next candidate point cause the step size parameter
However, this stationary assumption may be violated while optimizing impedance on a cognitive radar transmitter that is quickly changing its transmission frequency content. For instance, the radar's transmission frequency content may change after the search algorithm has begun to decrement its step size, resulting in a different optimal impedance not necessarily near the currently used impedance. In this situation, the algorithm must increase its step size to quickly reach the new optimum. While momentum-based methods such as classical momentum [35] and Nesterov acceleration [36] are often used in gradient applications for similar effect [37], their benefit for time-varying environments is less certain [38].
Instead, instances where the optimal impedance may have moved can be detected by monitoring how many consecutive steps with improved performance are made after a step size reduction. This trend provides a sense of performance momentum, rather than the trajectory momentum of other approaches. Assuming halved step sizes, if more than two consecutive steps observe improved performance, then it is expected that the optimal point no longer lies in a region that has been overstepped. In this case, the step size can be doubled. For quick recovery, this doubling action can be repeated until a decrease in performance is observed (indicating overstep and a need to halve the step size) or the maximum allowed step size is reached. To determine search convergence and end the search, the existing minimum step-size threshold technique of [13], [19]–[21], [24], [31] is used. Parameters related to step size convergence are included in Table III.
Note that comparing the average performance between candidate points has the same transmit configuration observation requirements as gradient estimations. That is, at least one transmit configuration must have been observed at both candidate points in order to make a valid comparison. In instances where no valid comparison can be made, we maintain both the record of consecutive performance improvements and the current step size.
D. Cognitive Radar Behavior Transition Detection
Once the search algorithm converges, it is necessary to continue observing the cognitive radar's behavior for any changes (such as a change in transmission frequency content) that may appreciably reduce performance, warranting reoptimization of the load impedance. As discussed in [39], the EMD is used to quantify the amount of change in the cognitive radar's chosen transmit frequencies over time by producing transmit frequency probability distributions from the transmitted waveforms and evaluating the distance between these distributions.
Once the
search converges, the transmit frequency distribution that was observed
during the final measurement window of the search is used to represent
the current “optimized” configuration. Afterwards, additional transmit
frequency distributions are continually evaluated using the same
measurement window, and the normalized EMD between the current
distribution and the optimized configuration is determined. If the
current and optimized configurations have a normalized EMD greater than
0.1, then the search algorithm is reactivated to handle the new
behavior. Unlike when starting the initial search process, the
reactivated search begins with
One advantage of this algorithm is its flexibility. Because it does not solely rely on a look-up table, the algorithm actually can achieve the best performance available from the system over a variety of environmental conditions or system changes. However, we have previously shown that look-up tables can speed the optimum identification in circuit gradient searches [20], and such improvements may also be possible in this scenario. However, a look-up table will need to be more diverse in this situation, due to the large number of possible transmit center frequency and bandwidth combinations in this problem.
Demonstration of Cognitive Radar Circuit Optimization
A. Test Configuration
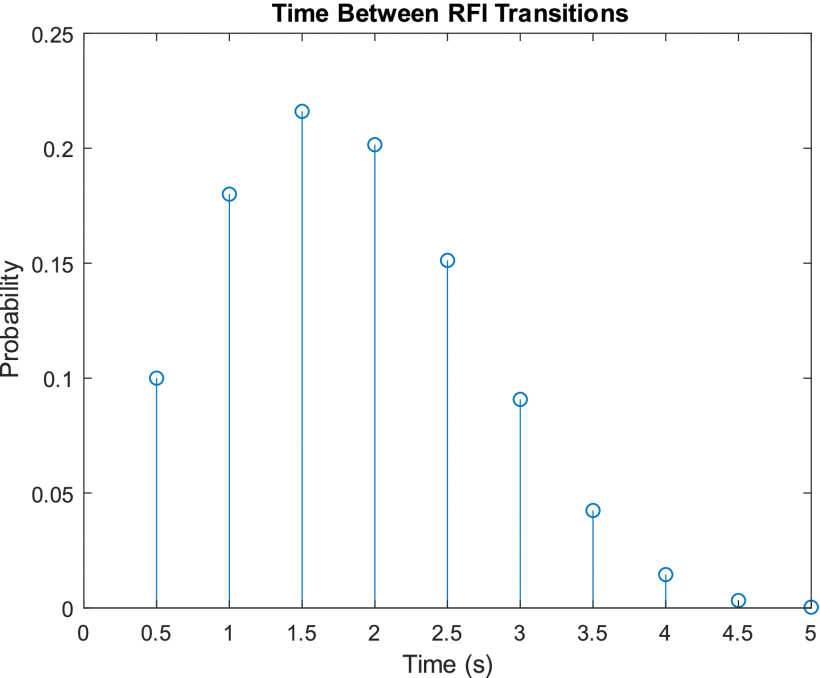
To demonstrate the circuit optimization of the previous section in conjunction with the SDRadar setup of Section II, a randomly varying RFI environment was generated and presented to the cognitive radar. The possible RFI patterns were selected to produce a wide variety of distinct SDRadar transmissions (narrow/wideband, with varying offsets from the band center frequency) and optimal measurement windows within a 100 MHz bandwidth. The chosen RFI pattern was switched at random time intervals according to the distribution of Fig. 14. Additionally, the SDRadar operating band hopped across five different operating bands in the United States radar S-band allocation, triggered at randomly varying intervals uniformly distributed from 2 to 25 s.
Probability distribution of the time interval between RFI pattern transitions, excluding transitions that result in an operating band change. This distribution arises from evaluating if the RFI pattern should be changed every 0.5 s, with the likelihood of a change occurring increasing each time the RFI pattern is not changed. The probability of an RFI change occurring begins at 10% and increases by 10 percentage points each time the RFI pattern is not adjusted, returning to 10% once a change occurs.
Prior
to the test, the optimal impedance was predetermined for each of the
possible SDRadar operation bands with no RFI present, and the radar
utilizing the entire 100 MHz band. This was used to define a baseline
performance metric:
![]() \begin{equation*}
{{P_{{\rm{base}}}}\ \left(t \right) = \ P\left({{Z_{{\rm{opt,\ full}}}}\left({{t_{{\rm{prev}}}}} \right),\ t} \right)} \tag{7}
\end{equation*}
\begin{equation*}
{{P_{{\rm{base}}}}\ \left(t \right) = \ P\left({{Z_{{\rm{opt,\ full}}}}\left({{t_{{\rm{prev}}}}} \right),\ t} \right)} \tag{7}
\end{equation*}![]() \begin{equation*}
{R\ \left(t \right) = \sqrt[4]{{\frac{{P\left(t \right)}}{{{P_{{\rm{base}}}}\left(t \right)}}}}.} \tag{8}
\end{equation*}
\begin{equation*}
{R\ \left(t \right) = \sqrt[4]{{\frac{{P\left(t \right)}}{{{P_{{\rm{base}}}}\left(t \right)}}}}.} \tag{8}
\end{equation*}
The optimal impedance was also predetermined for each of the allowed RFI patterns at each operation band. This information was used for assessment of algorithm performance by postcomparison with algorithm results.
B. Measurement Results
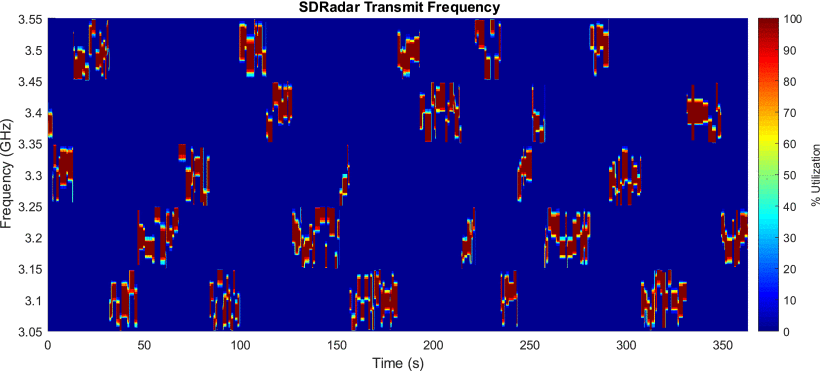
Fig. 15 shows the SDRadar's chosen transmissions over the course of an experimental period lasting 6 min. These transmissions are represented as a frequency utilization percentage for each measurement window processed during the experiment; that is, frequencies that were used in every transmitted chirp within the algorithm's current measurement window are marked as 100% and frequencies that were never used in any chirp within the window are marked as 0%. This provides an indication of the frequencies that were being evaluated at each search operation (performance or EMD measurement).
SDRadar transmit frequency utilization in response to time-varying RFI. Large jumps correspond to SDRadar operating band changes triggered by insufficient available transmit bandwidth, while smaller variations correspond to minor adaptations to RFI changes within the current operating band.
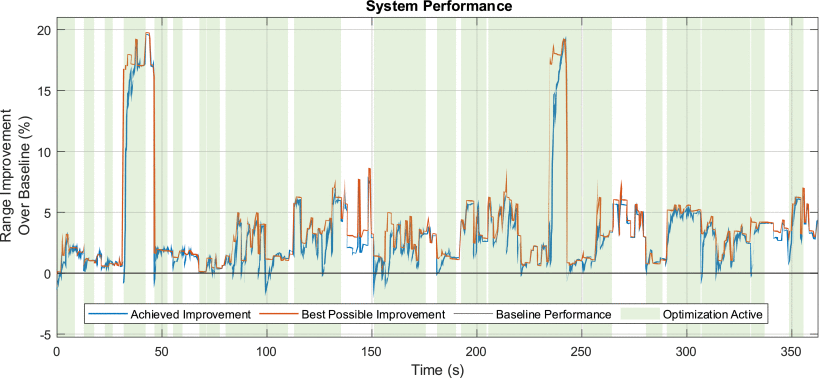
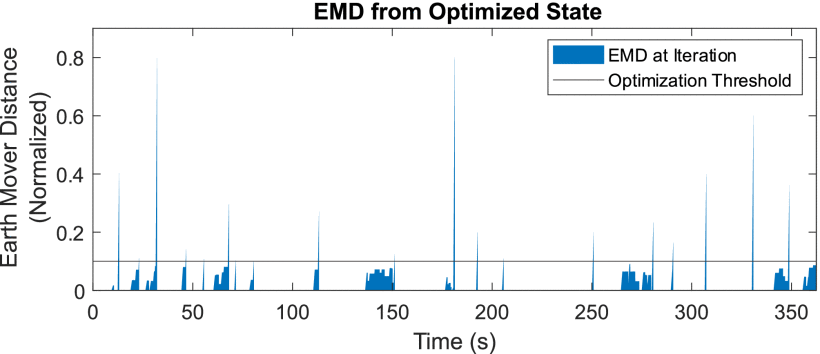
Fig. 16 shows the improvement in maximum detectable radar range obtained by the algorithm in comparison to the baseline metric of (7), as calculated in (8), the maximum improvement that could be obtained, and time periods when the optimization algorithm was active or idle, using the method of Section IV-D. The EMD values found during the experiment, used to determine when the optimization should become active, are shown in Fig. 17.
Percent increase in maximum detectable radar range obtained by the algorithm (blue) compared to the ideal result (orange). Regions shaded in green indicate periods when the average performance gradient search algorithm was active, while unshaded regions indicate periods when the search converged to a final impedance tuner setting and the optimization is waiting for a significant shift in the utilized frequencies before resuming the gradient search algorithm using the method of Section IV-D.
Normalized EMD between transmit frequency utilization at previous search convergence and current utilization. Instances where the distance crosses the threshold of 0.1 cause the average performance gradient search algorithm to resume from the current impedance.
These measurements show that the algorithm is consistently able to find the optimal performance, with some time delay as the algorithm responds to RFI changes, resulting in an average realized performance improvement of 3.29% over the baseline, compared to the optimal improvement of 3.77% on average. The rate at which our method is able to adapt to changes in the environment (as indicated by how quickly the achieved improvement approaches the best possible improvement following an environmental change) is impacted by the amount and rate of environmental change, preventing more general convergence analysis. For instance, the largest and often slowest possible improvements are associated with transitions from an operating band of 3.5 to 3.1 GHz, where an amplifier optimized for 3.5 GHz would perform quite poorly at 3.1 GHz. Additional improvements to the rate of adaptation are expected by using a look-up table, as shown in our previous work [19], [20], [40]. Furthermore, we expect the average improvement obtained by this method to become more pronounced when applied to wider band dynamic systems that are capable of frequent, larger jumps in operating frequency.
In some instances, the algorithm appears to outperform the expected optimal performance, such as at 187 s. However, in these cases, the output power observed by the algorithm differs from the premeasured optimum performance by less than the margin of error for what we observe when returning to a certain configuration (<0.1 dB variation). These variations are due to changes in temperature and minor inconsistencies in SDR performance when adapting to various frequent bands.
In other instances, the algorithm obtains performance below the expected baseline performance. The lesser deficits are also attributed to small power differences below our margin of error. Larger deficits are due to the impedance being optimized for the specific circumstances prior to the band hop, while our baseline metric assumes no RFI. In these cases, it is possible for the more specific optimized impedance to perform worse at the new operating band than the baseline impedance.
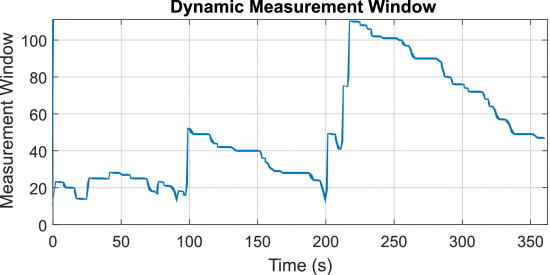
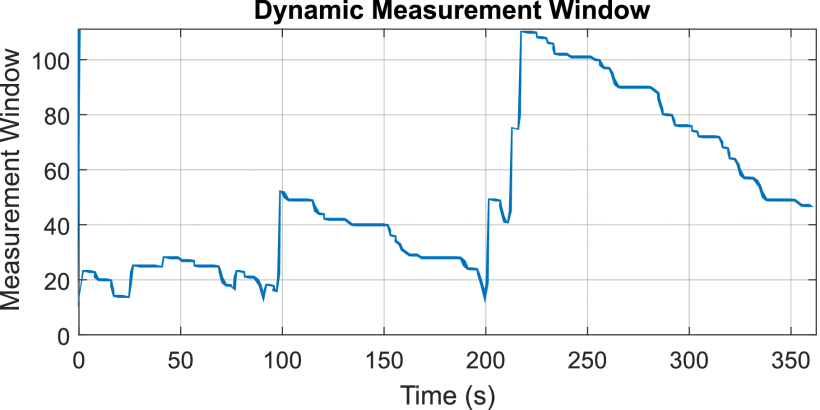
Finally, the measurement window used by the algorithm throughout the experiment is shown in Fig. 18. These results demonstrate that the dynamic window algorithm correctly chooses sudden, significant window increases when necessary, along with gradual decreases when it is clear that the window can be reduced without degrading the search algorithm's performance.
Dynamic measurement window versus time. The window adjusts throughout the experiment period in response to changes in RFI and the resulting behavior of the cognitive radar. Instances where the radar behavior transmits more consecutive unique pulses without repeat require larger measurement windows to accurately sample the radar's performance for optimization.
Conclusion
A gradient-based search algorithm has been demonstrated for real-time impedance tuning to maximize average performance of a cognitive radar in a measurement-based optimization during on-going spectrum sharing. This search is useful in a scenario where it is not possible to optimize the performance of each individual transmission, such as when the impedance tuning time is significantly slower than the rate at which the operating frequency and/or bandwidth changes. This can allow for reconfiguration of the transmission frequency and bandwidth on the order of the radar PRI with a tuner requiring hundreds of milliseconds to reconfigure, maintaining reasonable output power on target despite necessary, quick changes in frequency to avoid interference.
ACKNOWLEDGMENT
The views and opinions expressed do not necessarily represent the views and opinions of the U.S. Government.


